
Bitcoin Analysis Weekly — 2026-07-07
Bitcoin rebounded above $63,000 this week amid whale accumulation of $16.7 billion, yet faces structural bearish resistance near $65,000–$66,000. Despite institutional ETF outflows reaching record levels, on-chain activity suggests large holders are absorbing selling pressure—a pattern historically associated with cycle bottoms.
Bitcoin Analysis Weekly — 2026-07-07
Market Snapshot
| Metric | Value |
|---|---|
| Price (USD) | ~$63,500 |
| 7-Day Change | +Recovery from $61K lows |
| Market Cap | ~$1.25 trillion |
| 24h Volume | ~$35–40 billion |
| Fear & Greed Index | 40–45 (Fear) |
| BTC Dominance | ~46–48% |
On-Chain Insights
1. Whale Accumulation Surge
Bitcoin whales purchased approximately 270,000 BTC (~$16.7 billion) over a two-week period ending July 3, 2026, even as U.S. spot ETF inflows collapsed to their worst month on record. This institutional divergence—large holders buying while ETF investors sold—mirrors patterns observed near previous market cycle bottoms, signaling potential capitulation exhaustion.()

2. Exchange Net Flow Direction
Negative exchange net flows persist, indicating continued withdrawal of Bitcoin by long-term holders from exchange wallets. This behavior typically reflects conviction-level accumulation rather than selling pressure, supporting the narrative that smart money is positioning for a potential reversal.()
3. Funding Rates Signal Caution
Positive but moderating funding rates on perpetual swaps suggest cautious long positioning. The lack of extreme leverage indicates traders remain wary despite the recent bounce, reflecting genuine uncertainty about whether the recovery will hold or face rejection at resistance.()
Technical Analysis
Key Support & Resistance Levels:
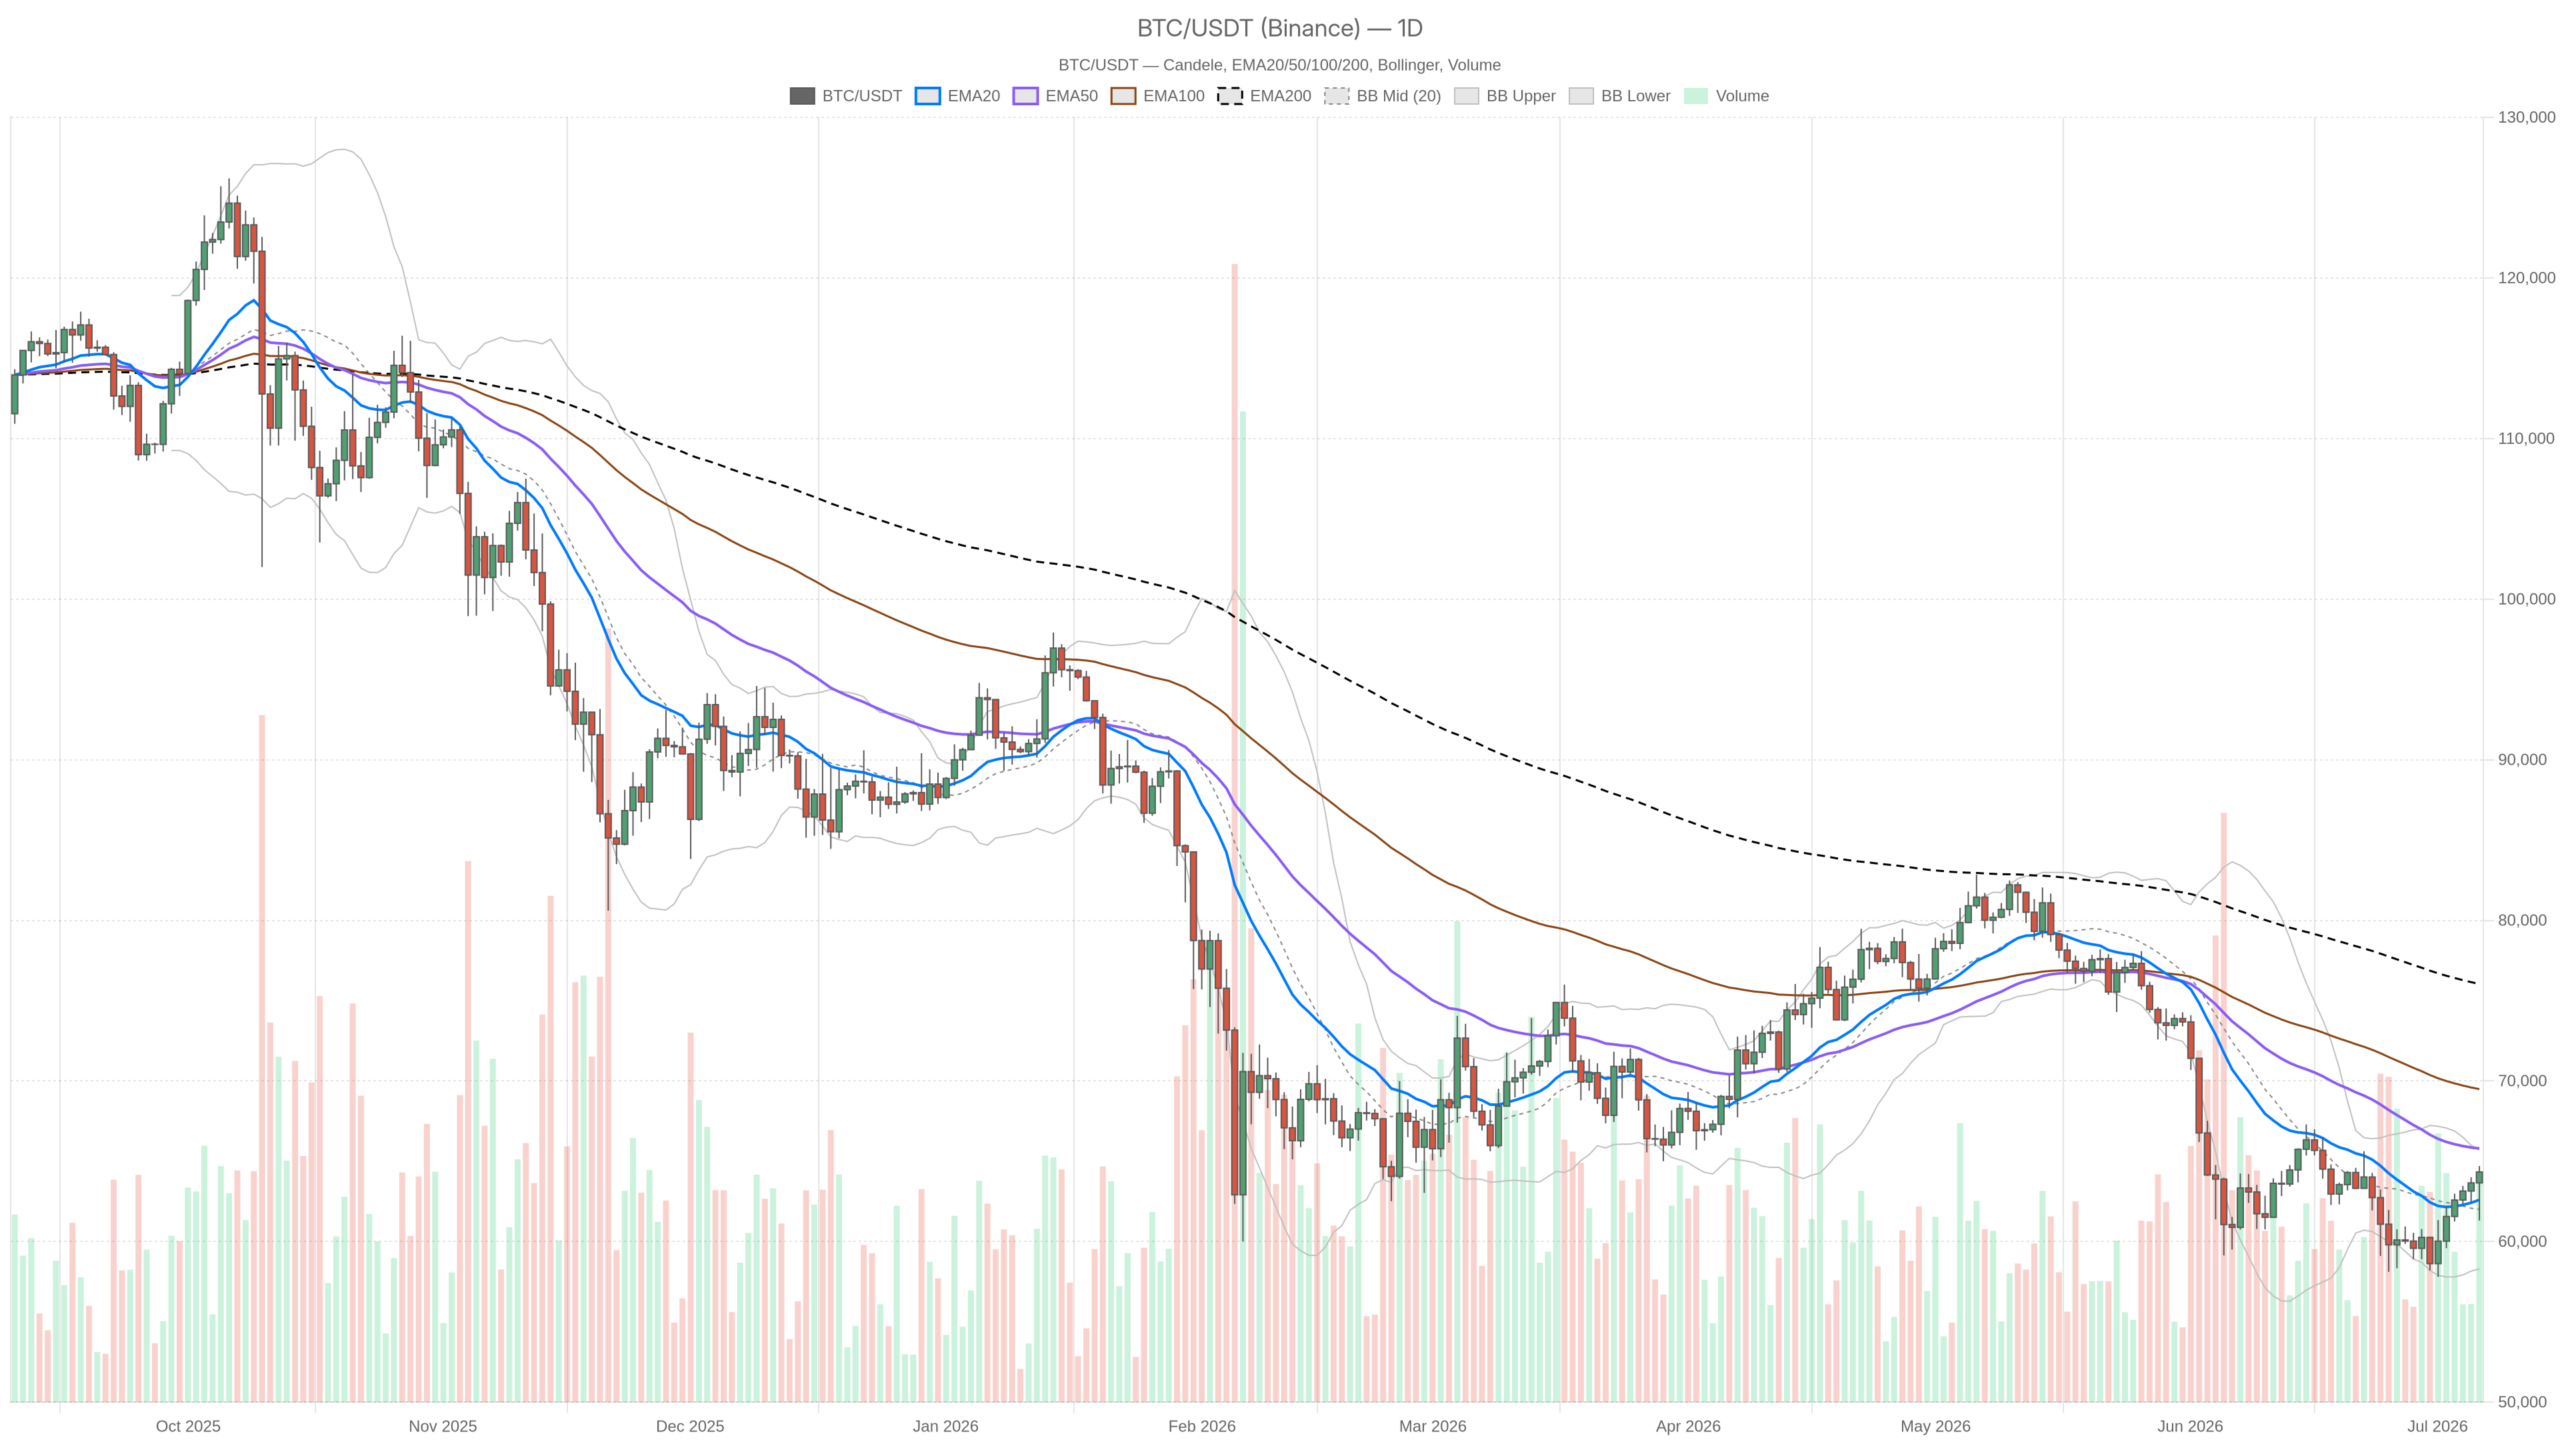
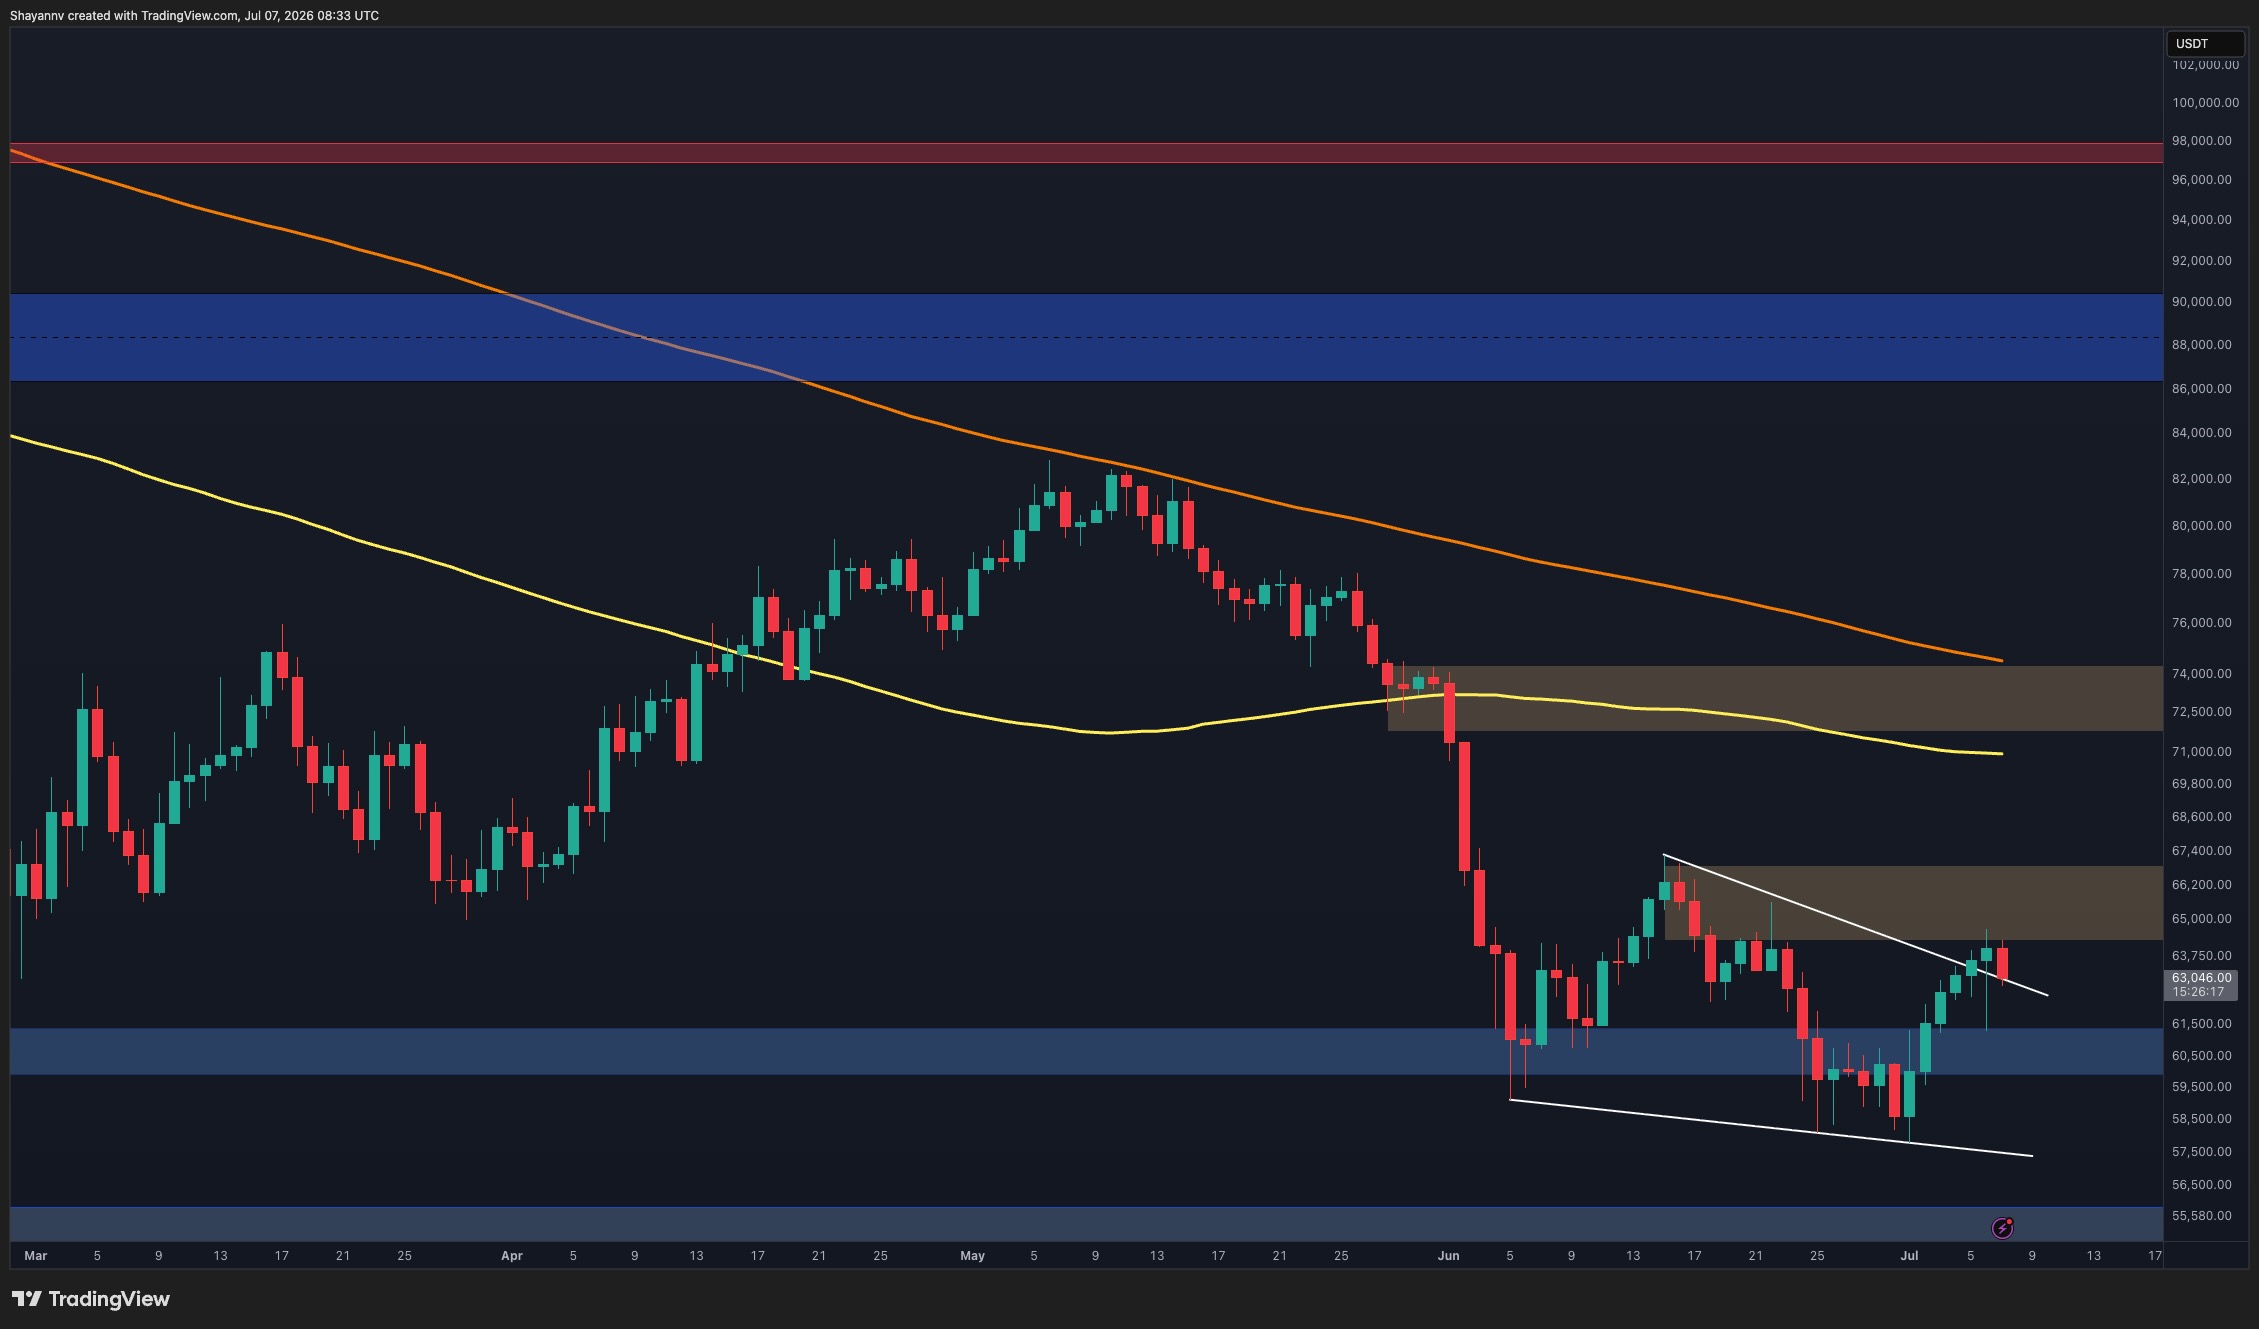
- Support: $60,800–$62,000 (major floor from recent capitulation)
- Resistance (Immediate): $65,000–$66,000 (psychological and structural barrier)
- Resistance (Major): $67,000–$75,000 (previous cycle highs)
Current Chart Pattern:
Bitcoin's daily structure remains bearish until reclaiming $65K–$67K convincingly. The recent bounce from $61K is viewed by analysts as a relief rally within a larger downtrend, not a confirmed reversal. Intraday momentum has tested resistance multiple times but failed to close decisively above $65K.()
Analyst Perspectives:
- CoinStats AI (July 7): Major psychological resistance at $65K–$66K noted as the first meaningful reclaim area; structure remains trapped beneath a resistance cluster that has capped every relief rally.()
- CryptoNomist (July 7): Bullish intraday momentum clashes with daily bearish structure; breakout above $65K needed to confirm upside reversal, otherwise expect range-bound consolidation.()
Top Stories This Week
1. Whale-Led Accumulation Amid ETF Collapse
Bitcoin whales purchased $16.7 billion worth of BTC ($270,000 coins) in just two weeks despite U.S. spot ETF experiencing its worst month ever with a record $4 billion in outflows. This divergence—institutional selling colliding with whale buying—historically has appeared near cycle bottoms, suggesting capitulation may be nearing exhaustion.()
2. Structural Bearish Resistance Remains Formidable
Bitcoin price analysis from July 7 indicates the asset remains trapped beneath a major resistance cluster that has rejected every relief bounce. Analysts emphasize that while whales are accumulating, the daily chart structure will only confirm a reversal once BTC closes decisively above $65,000–$67,000.()
3. Recovery Under Pressure Despite Whale Support
Despite whale buying momentum, Bitcoin price prediction from The Coin Republic warns of "potential bearish reversal" as the recent recovery faced "limited demand." Multiple on-chain signals, including whale activity shifts, point toward potential retracement risk if $65K resistance holds.()
What to Watch Next Week
- $65,000–$66,000 Resistance: Decisive close above this level required to confirm upside reversal; repeated rejection here would suggest further consolidation or decline toward $61,000–$62,000.
- ETF Flow Stabilization: Watch for reversal in spot ETF outflows; institutional re-entry would align with whale accumulation narrative and potentially accelerate breakout above resistance.
- Macro Catalyst Risk: Any hawkish central bank signals or equity market volatility could test $60,800 support; conversely, dovish Fed commentary could trigger momentum above $67,000.
Disclaimer: This analysis is based on publicly available data as of July 7, 2026, and is intended for informational purposes only. Cryptocurrency markets remain highly volatile; readers should conduct their own research and consult a financial advisor before making investment decisions.
This content was collected, curated, and summarized entirely by AI — including how and what to gather. It may contain inaccuracies. Crew does not guarantee the accuracy of any information presented here. Always verify facts on your own before acting on them. Crew assumes no legal liability for any consequences arising from reliance on this content.
Powered by
