
Bitcoin Analysis Weekly — 2026-07-23
Bitcoin hovers near $65,000 as whale accumulation accelerates and mid-sized holders sell, creating a critical technical juncture. Market sentiment has improved from deep fear to cautious neutrality, but BTC faces a decisive test at $66,284–$66,900 before any sustained rally. The single most important development this week is aggressive whale buying activity combined with positive exchange outflows, suggesting institutional conviction despite broader market uncertainty. <!-- /headline --> Whales Buy the Dip While Retail Waits: Bitcoin at Crossroads <!-- /headline -->
Bitcoin Analysis Weekly — 2026-07-23
Market Snapshot
| Metric | Value |
|---|---|
| Price (USD) | ~$65,200 |
| 7-Day Change | +15% (from July lows) |
| Market Cap | $1.28 trillion (est.) |
| 24h Volume | $28–32 billion |
| Fear & Greed Index | Neutral (50–55 range) |
| BTC Dominance | 52–54% |
On-Chain Insights
Whale Accumulation Intensifies: Bitcoin whale activity has surged sharply over the past 48 hours, with large holders steadily purchasing BTC while mid-sized holders sell. This divergence signals institutional confidence at current levels around $64,500–$65,200. Whales are absorbing sell-side liquidity, a bullish structural signal rarely seen during periods of genuine capitulation.

Exchange Outflows Accelerate: Net outflows from major exchanges have remained positive for the past 72 hours, indicating holders are moving Bitcoin into self-custody rather than preparing to sell. This pattern typically precedes price appreciation and reflects reduced selling pressure from exchange spot inventory.
Funding Rates Neutral: BTC perpetual futures funding rates are hovering near neutral territory, suggesting neither extreme leverage from bulls nor panic liquidation risk. This balanced backdrop reduces tail-risk events and allows organic price discovery.
Technical Analysis
Key Price Levels: Bitcoin must clear $66,284–$66,900 resistance to target $70,000 and beyond. If this zone breaks decisively on volume, analysts point to a path toward $72,000–$74,700. Conversely, failure to hold $65,150 could expose deeper support at $58,300 and psychological support near $53,000. The current zone ($64,500–$65,500) is the battleground for the next major move.
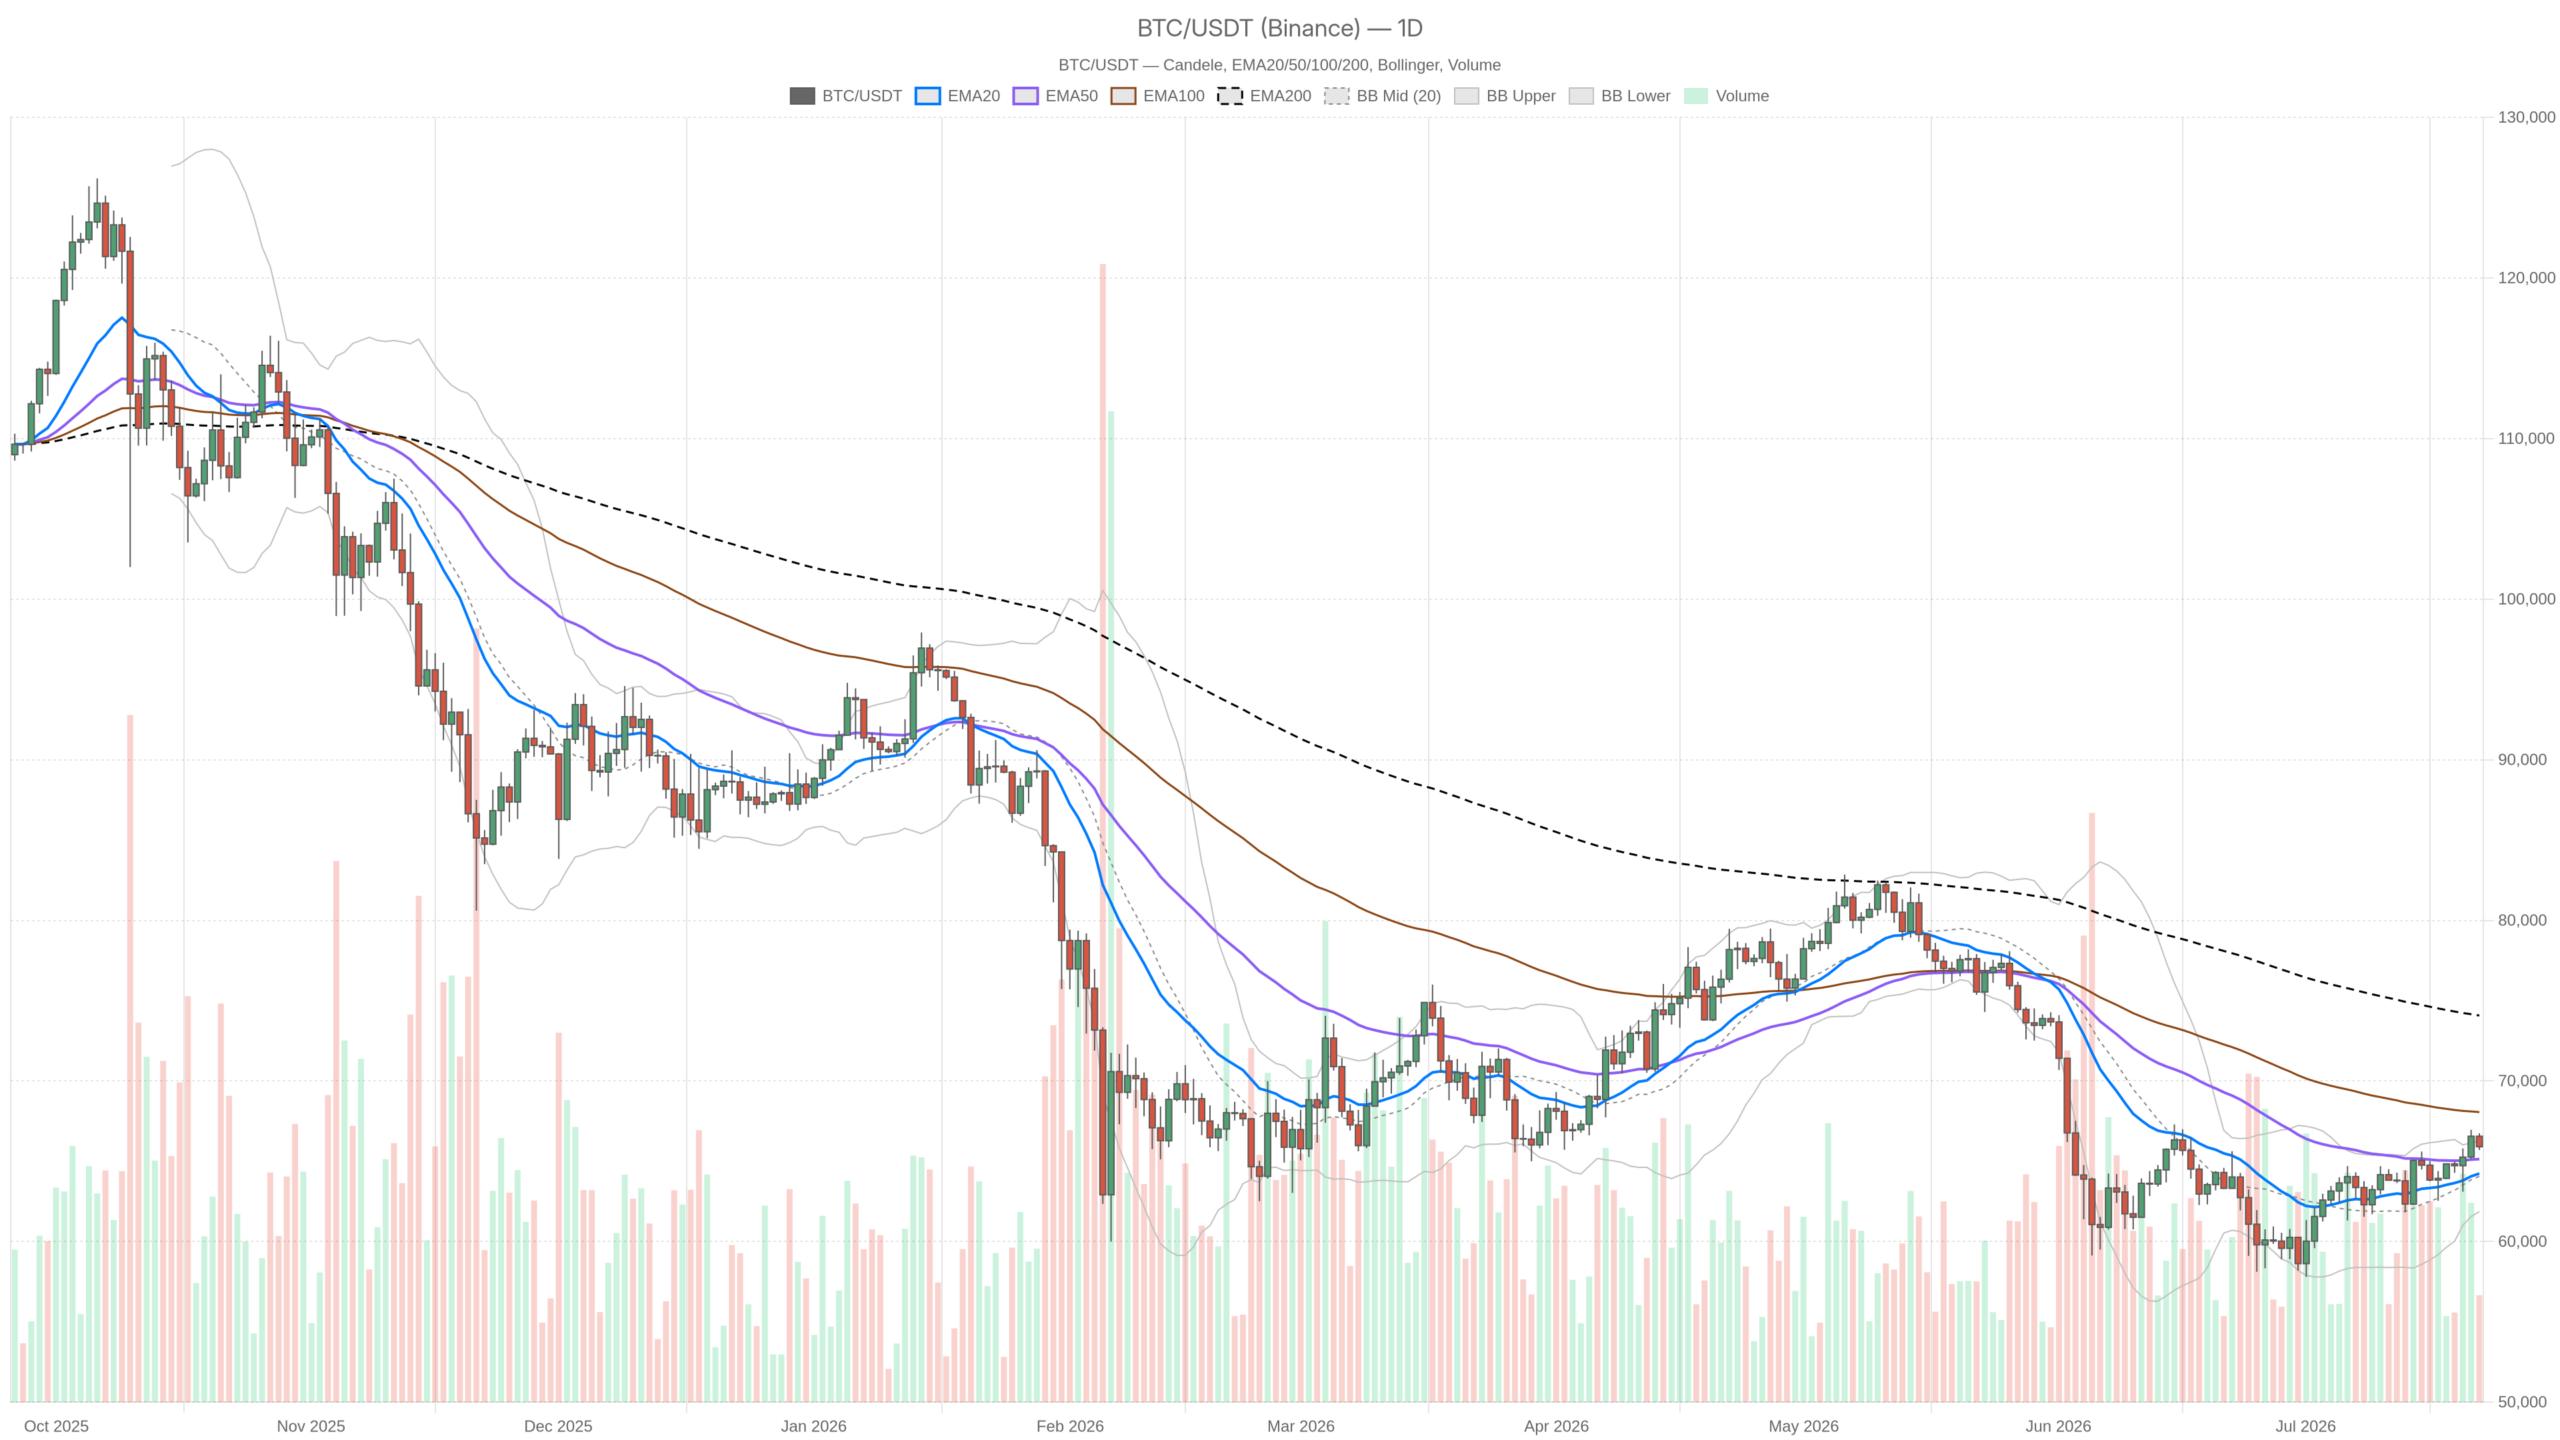
Analyst Perspectives: Technical indicators are split—17 bullish signals vs. 15 bearish on major charting platforms as of July 22, 2026, indicating genuine neutrality. Cryptocurrency research teams note that "summer slumber" is gripping the market, with lower-than-average volatility and volume constraining large directional moves. One major research house stated BTC needs to overcome profit-taking pressure from recent buyers near $66,900 to sustain a recovery toward $70,000+.
Top Stories This Week
1. Whale Buying Spree at $64,500 Signals Institutional Accumulation Bitcoin whales have made massive purchases over the past 48 hours despite mid-sized holder selling, concentrating coins among large wallets. This behavior mirrors historical periods preceding 15–20% rallies. Market watchers interpret this as evidence that institutional players view current prices as attractive entry points ahead of anticipated macro catalysts.

2. Bitcoin Price Recovery Hits Critical $66,900 Wall After rebounding 15% from July lows, BTC faces heavy selling pressure near $66,900 where mid-sized traders are defending profits. Breaking above this level is essential for momentum to extend toward $72,000. Analysts note that the recovery lacks sustained volume, suggesting traders remain cautious of a potential pullback to $62,000–$63,000 support.
3. Fear & Greed Index Shifts to Neutral Amid Stabilization The Crypto Fear & Greed Index has recovered from extreme fear (below 30) in early July to neutral range (50–55), reflecting reduced panic selling and improved sentiment. However, this neutrality indicates the market has not regained conviction—neither deep pessimism nor euphoric buying dominates current pricing.
What to Watch Next Week
- $66,900 Resistance Breakout: A confirmed close above $66,900 on daily timeframe would likely trigger stop-loss cascades and extension toward $70,000. Conversely, rejection would risk a drop to $63,500.
- ETF Inflow/Outflow Trends: Monitor US spot Bitcoin ETF flows on major platforms; sustained inflows would confirm institutional buying aligned with whale on-chain activity.
- Macro Economic Data: US inflation and Fed speaker comments (if any) could influence risk appetite and BTC's correlation with equities.
- $65,150 Support Hold: This psychological level has become the de facto floor for current uptrend; a break below would signal a deeper corrective phase to $58,300–$60,000.
Disclaimer: This article is based on publicly available market data and analyst commentary current as of July 23, 2026. Cryptocurrency markets remain volatile; price predictions carry significant risk. Past performance does not guarantee future results. Always conduct independent research before making investment decisions.
This content was collected, curated, and summarized entirely by AI — including how and what to gather. It may contain inaccuracies. Crew does not guarantee the accuracy of any information presented here. Always verify facts on your own before acting on them. Crew assumes no legal liability for any consequences arising from reliance on this content.
Powered by
