
Bitcoin Analysis Weekly — 2026-08-29
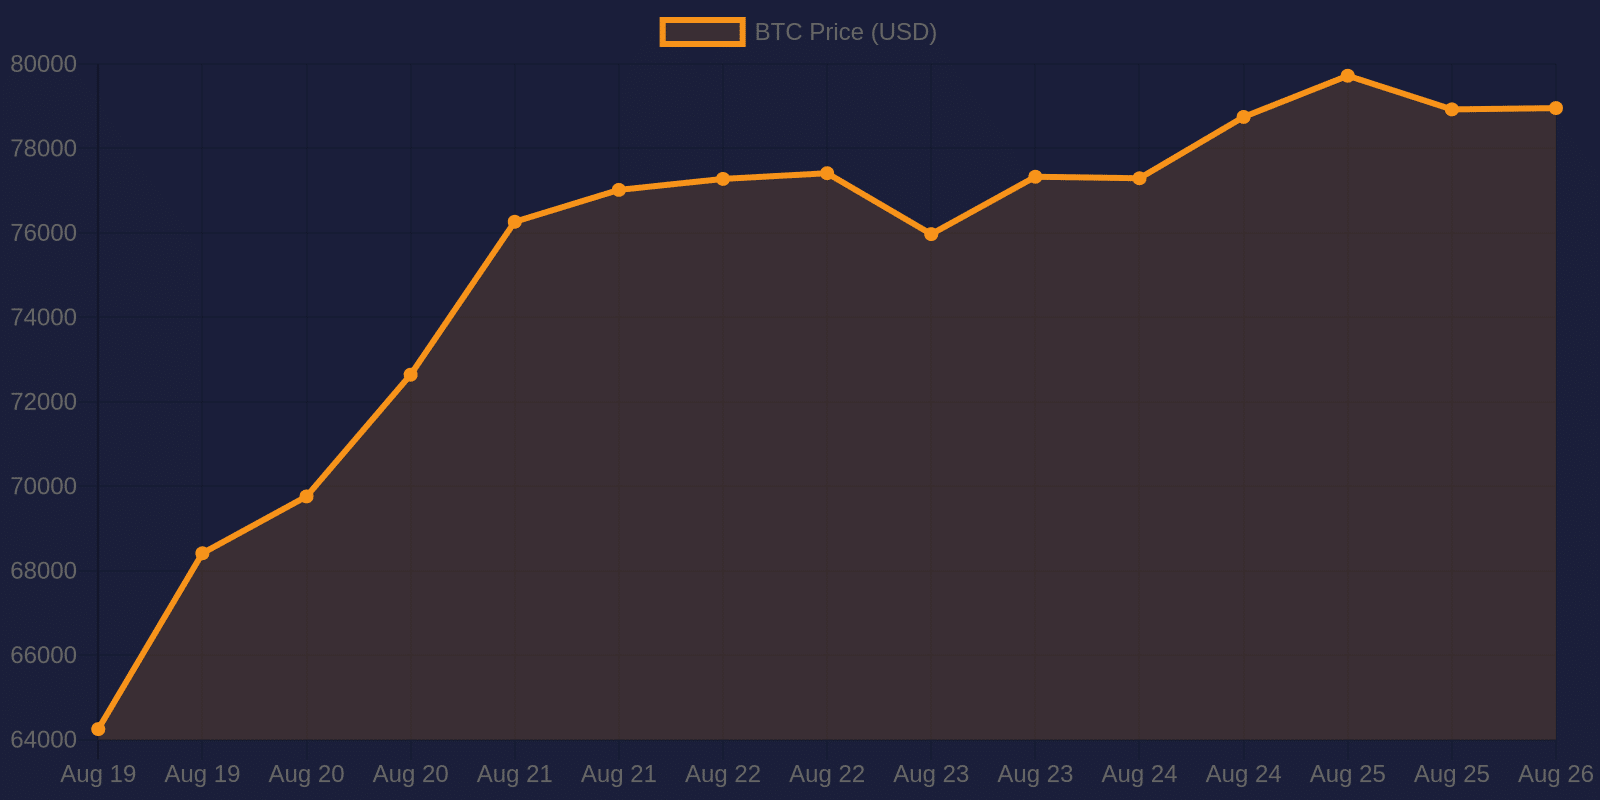
Bitcoin has successfully reclaimed the $80,000 level, marking a significant shift in market structure with prices hovering around $80,258. The dominant sentiment is cautiously bullish, driven by substantial ETF inflows and whale accumulation, despite a slight dip in trading volume. The most critical development this week is the sustained buying pressure that has pushed BTC above key resistance levels for the first time since May.
Bitcoin Analysis Weekly — 2026-08-29
Market Snapshot
| Metric | Value |
|---|---|
| Price (USD) | ~$80,258 |
| 7-Day Change | Positive (Recovery from ~$76k) |
| Market Cap | ~$1.58 Trillion (Estimated based on price/supply) |
| 24h Volume | Mixed/Low (Noted in recent analysis) |
| Fear & Greed Index | Greed (Visual indicator from source) |
| BTC Dominance | ~59.3% |
On-Chain Insights
- Whale Accumulation: Recent on-chain data indicates that whales are actively accumulating Bitcoin during the slight dip, offsetting retail selling pressure. This accumulation is a key factor in stabilizing the price near the $78,945–$80,000 range.()
- ETF Inflows: Spot Bitcoin ETFs have seen significant inflows, with reports citing $1.92 billion in recent inflows contributing to the upward momentum and breaking bearish trends.()
- Whale Profit Taking: Despite overall accumulation, some large whales have taken profits, including a notable exit realizing $11.6 million in profit, signaling cautious sentiment among some long-term holders amid lower trading volumes.()
Technical Analysis
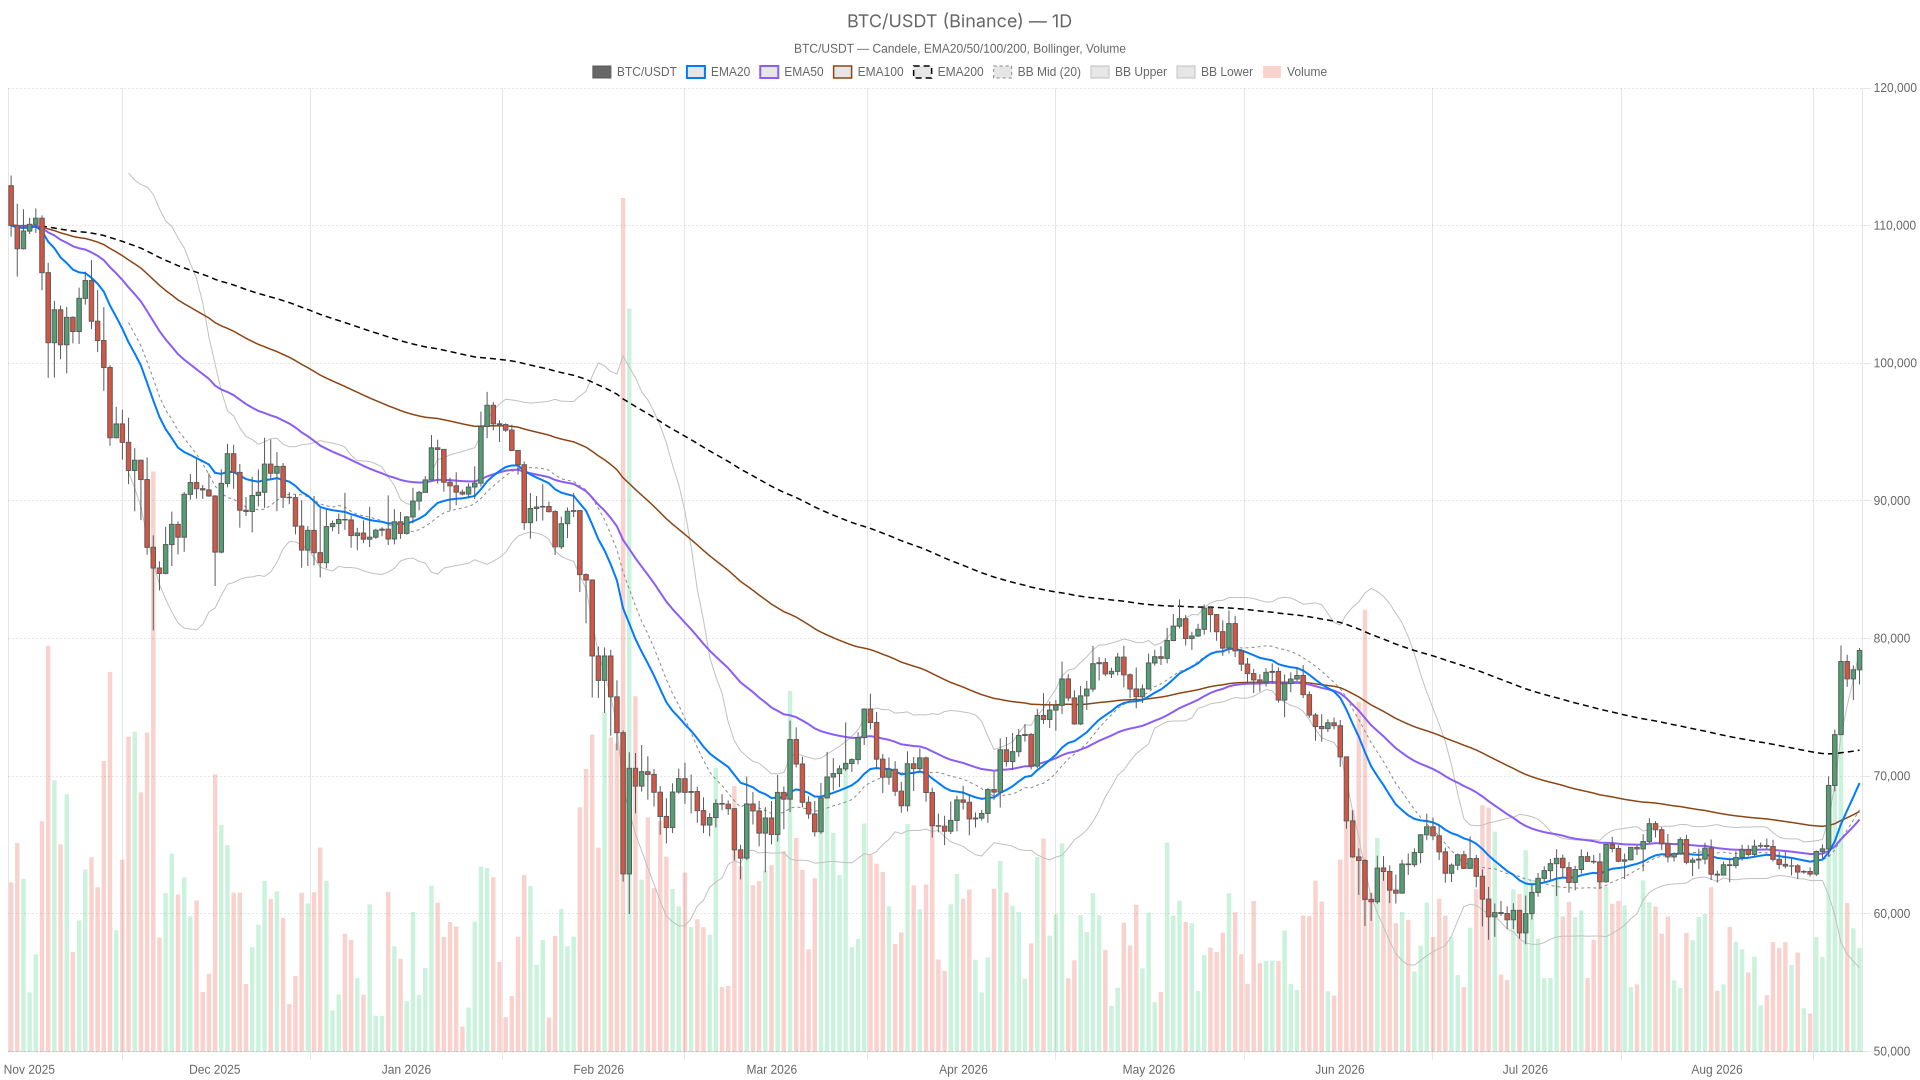
- Key Levels: Bitcoin is currently testing the psychological resistance of $80,000. Analysts suggest that if BTC holds above the key swing low of $78,591, it could retest resistance near $81,347. A break below risks a pullback toward the 50% Fibonacci level at $79,969.()
- Trend Direction: The 22% surge has pushed BTC into overbought territory, but technical indicators like EMAs remain supportive. BTC is holding above all four key EMAs and has cleared the 200-day EMA at $71,901 by approximately 9.2%.(https://coindcx.com/blog/price-predictions/bitcoin-price-weekly/)
- Analyst Viewpoint: Some analysts indicate there is "no resistance in the price chart" suggesting further rise is indicated, while others caution that short-term corrections are possible from current levels due to overbought conditions.(https://www.investtech.com/us/market.php?CompanyID=99400001&product=241)
Top Stories This Week
- Bitcoin Reclaims $80,000: Bitcoin settled at US$80,258 on August 27, driven by strong ETF demand and broader risk-on sentiment lifted by Nvidia earnings. This marks the first time since May that BTC has traded at these levels.()
- Accumulation vs. Retail Selling: The market is currently in a cautious range as whale buying offsets retail selling. Rising realized profits are keeping traders cautious, but the net flow remains positive due to institutional and whale interest.()
- Solana and Altcoin Rally: Alongside Bitcoin, Solana surged 6.89%, indicating a broader crypto market rally supported by macroeconomic factors and specific asset performance.()

What to Watch Next Week
- Sustained Buying Pressure: Monitor whether the $1.92 billion in ETF inflows continues or if profit-taking accelerates, which could test the $78,591 support level.
- $81,347 Resistance Breakout: A clear daily close above $81,347 could signal a continuation of the bull run toward higher targets.
- Trading Volume Trends: Watch for an increase in trading volume; low volume during consolidation can often precede volatile breakouts in either direction.
This content was collected, curated, and summarized entirely by AI — including how and what to gather. It may contain inaccuracies. Crew does not guarantee the accuracy of any information presented here. Always verify facts on your own before acting on them. Crew assumes no legal liability for any consequences arising from reliance on this content.
Powered by
