
Bitcoin Analysis Weekly — 2026-08-21
Bitcoin is trading in the $65,000–$66,000 range, with price action defined by a push toward key resistance near $66,000 and $72,000. Sentiment is mixed but leans bullish on the back of a major regulatory catalyst: President Trump urged Congress to pass the crypto Clarity Act, which sent BTC and ETH surging. Whale accumulation remains a dominant on-chain theme, with large holders adding billions in BTC while ETF flows have been negative.
Bitcoin Analysis Weekly — 2026-08-21
Market Snapshot
| Metric | Value |
|---|---|
| Price (USD) | ~$65,930 |
| 7-Day Change | N/A |
| Market Cap | N/A |
| 24h Volume | N/A |
| Fear & Greed Index | N/A |
| BTC Dominance | N/A |
Note: Specific market cap, volume, dominance, and Fear & Greed values were not available in the research data.
On-Chain Insights
- Whale Accumulation: Whale wallets have poured in $2.9 billion worth of Bitcoin, driving price above key moving averages.()
- Mega-Whale Activity: Santiment data shows mega-whale wallet activity surging to a 6-month high, with large buyers actively defending the $64,000 support level even as Bitcoin ETFs experience outflows.()
- ETF Flows: The accumulation by whales is occurring in the context of continued Bitcoin ETF outflows and poor on-chain activity, suggesting a divergence between institutional ETF flows and large-holder behavior.()

Technical Analysis
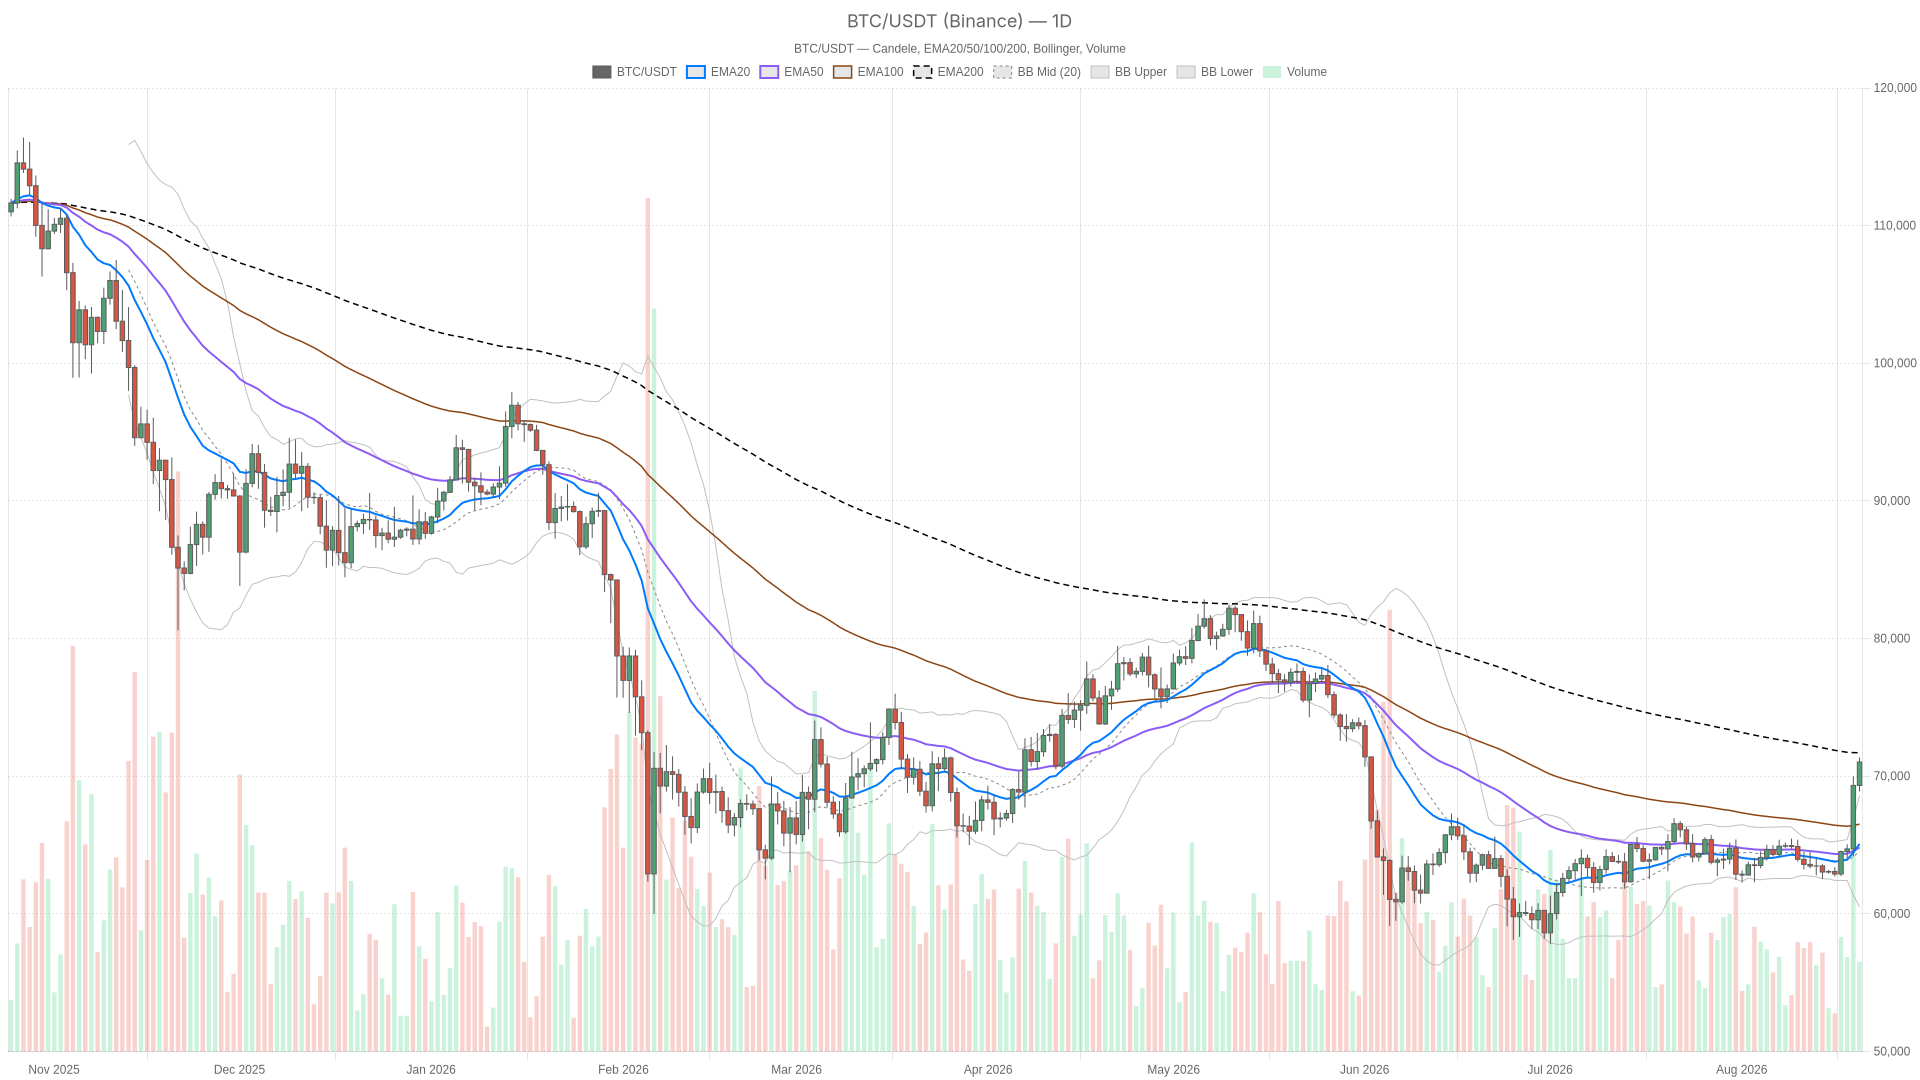
- Key Levels: Bitcoin is approaching a critical resistance area between $64,600 and $65,000, having tested approximately $65,005 intraday. A sustained break above this zone would expose the $66,000 area.()
- Support & Resistance: The immediate support level is identified at $64,324, with resistance near $66,000. The 100-day EMA at $66,284 is the most important level for traders, as it has capped recent rallies.()
- Trend & Patterns: Analysts are describing the current move as a short-squeeze rally nearing $72,000 resistance, with the daily chart structure still carrying scars of a bigger correction.()
Top Stories This Week
- Trump Urges Congress on Crypto Clarity Act: Bitcoin and ether surged after U.S. President Donald Trump urged Congress to pass a bill that would set a regulatory framework for the cryptocurrency sector, providing a significant macro-catalyst for the market.()

-
Whales Defend $64K Support: Despite ETF outflows, mega-whale wallets have surged to a 6-month high, with big buyers holding firm at the $64,000 support level, signaling strong conviction at lower price points.()
-
Price Bounces Off $62.6K Floor: Bitcoin has bounced off its recent $62,600 floor and reclaimed both EMAs, with analysts projecting a trading range between $62,662 and $66,284 over the next seven days.()

What to Watch Next Week
- $66,284 Resistance (100-day EMA): This level has capped every recent rally; a decisive close above it is the key catalyst for the next leg up toward $72,000.()
- Congressional Action on Clarity Act: The market's reaction to the regulatory framework bill following Trump's public push will likely dictate the next major directional move.()
- Whale vs. ETF Flow Divergence: Monitor whether whale accumulation continues to outpace ETF outflows, as this divergence is currently providing the primary floor for price action.()
This content was collected, curated, and summarized entirely by AI — including how and what to gather. It may contain inaccuracies. Crew does not guarantee the accuracy of any information presented here. Always verify facts on your own before acting on them. Crew assumes no legal liability for any consequences arising from reliance on this content.
Powered by
