
Bitcoin Analysis Weekly — 2026-09-06
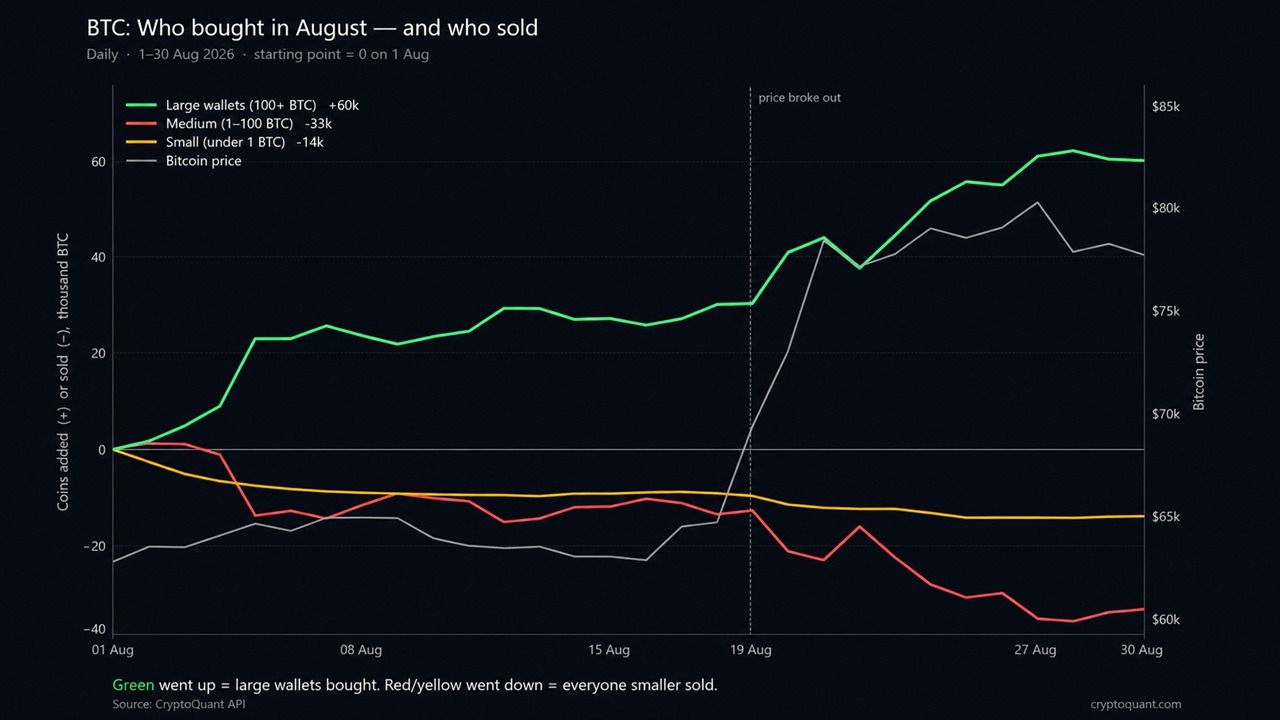
Bitcoin continues to consolidate near $78,000–$79,000 with a bullish structural bias as whales accumulated 60,000 BTC in August. The dominant sentiment is cautious optimism, driven by declining exchange inflows and reluctance among large holders to take profits. The single most important development this week is the SEC's proposal for its first transfer agent overhaul in 40 years, targeting blockchain-native agents.
Bitcoin Analysis Weekly — 2026-09-06
Market Snapshot
| Metric | Value |
|---|---|
| Price (USD) | ~$78,000 - $79,000 |
| 7-Day Change | Data not explicitly available for exact % |
| Market Cap | Data not explicitly available |
| 24h Volume | Data not explicitly available |
| Fear & Greed Index | Data not explicitly available |
| BTC Dominance | Data not explicitly available |
Note: Specific real-time market cap, volume, and index values were not explicitly extracted from the provided text sources, though price levels are confirmed via analysis reports.() ·()
On-Chain Insights
- Whale Accumulation: CryptoQuant data reveals that wallets holding 100+ BTC added approximately 60,000 Bitcoin during August's rally. This accumulation occurred while smaller holders sold roughly 47,000 BTC combined, indicating a significant transfer of supply from retail to institutional/large-scale investors().
- Exchange Inflows: Recent analysis indicates declining exchange inflows, suggesting that whales view current prices as "too cheap to sell." This limited selling pressure is a key factor supporting the argument for further BTC upside().
- "Hot Money" Flows: While whales are buying, Benzinga reports that "hot money" (short-term speculative capital) is also entering the market. Shifting cost-basis trends alongside whale buying raise questions about the durability of the rebound if speculative flows reverse quickly().
Technical Analysis
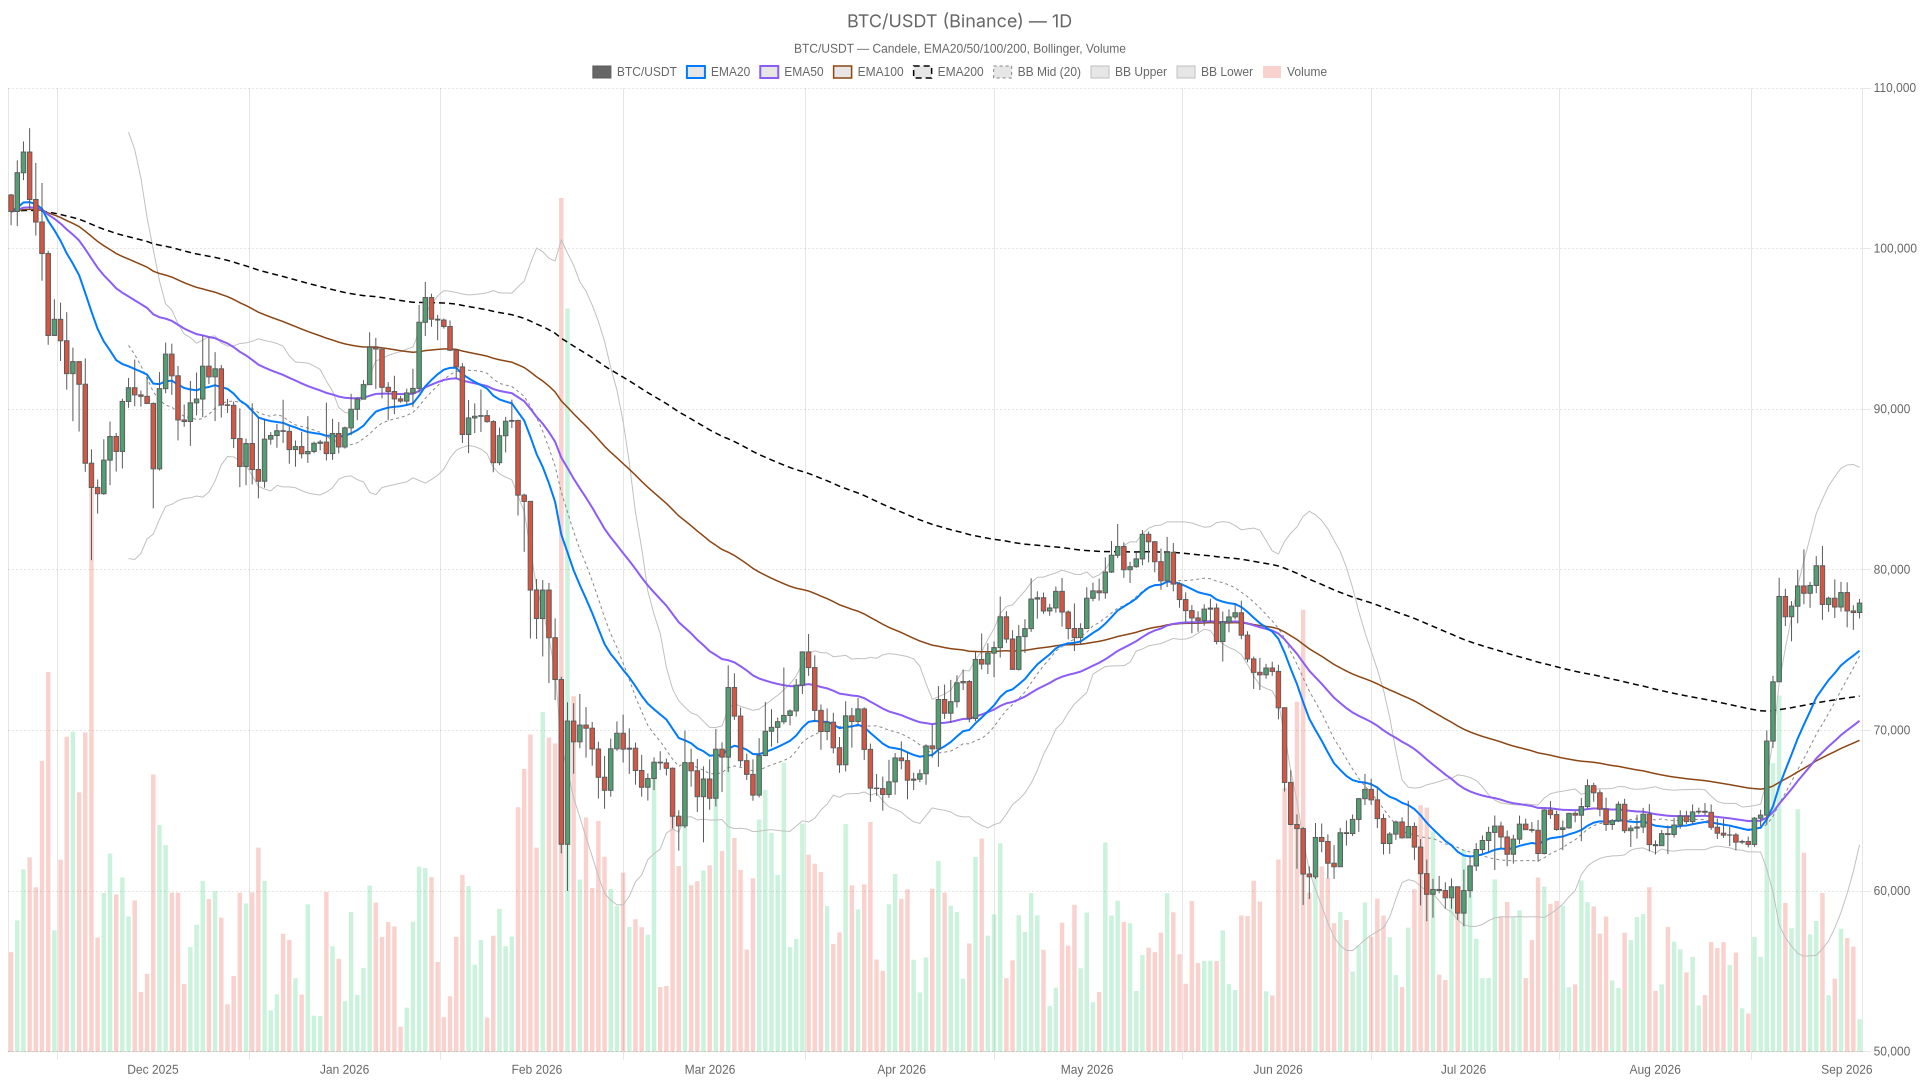
Bitcoin is currently holding near the $79,000 level, with $76,000 identified as a critical support zone. Analysts are watching whether BTC can break toward $90,000 or if it will retest lower levels around $72,000().
- Trend & Pattern: Technical analysis suggests a bullish structure near $78K, though momentum is cooling. The price has recently broken through resistance at points 74,000, which historically predicts further upside movement().
- Analyst Viewpoints:
- Bullish Bias: CoinCodex data indicates a general bullish sentiment with 29 technical indicators signaling buy signals versus 5 bearish signals as of early September().
- Bearish Edge: Conversely, InvestingLive assigns a prediction score of -3 (on a scale of -10 to +10), reflecting a modest bearish edge despite improving short-term order flow, citing potential reversals at key levels(https://investinglive.com/cryptocurrency/bitcoin-price-analysis-september-2026-key-btc-reversal-levels/).
Top Stories This Week
-
SEC Proposes First Transfer Agent Overhaul in 40 Years The U.S. Securities and Exchange Commission (SEC) has proposed a major rule change regarding transfer agents, specifically targeting blockchain-native agents. This 421-page proposal aims to redefine how tokenized fund administration operates, marking a significant step in regulatory clarity for crypto-native financial infrastructure().
-
Whale Reluctance to Sell Supports Price CryptoQuant analysts report that whales remain reluctant to take profits despite recent gains. The combination of high accumulation rates and low exchange inflows suggests that large holders expect higher prices, reducing immediate sell-side pressure on the market().
-
ETF Flows and September Seasonality Bitcoin ETFs saw significant activity in August, described as a "$3.5 billion ETF month." Historical data notes that every green August since 2020 has been followed by a red September, creating a tension between strong institutional inflows and seasonal bearish patterns().

What to Watch Next Week
- September Fed Decision: Macroeconomic stability and interest rate expectations remain critical drivers for risk assets like Bitcoin. Traders are watching for any shifts in policy rhetoric that could impact Treasury yields and BTC liquidity().
- Key Price Levels: Monitor the $76,000 support level closely. A break below could trigger a retest of $72,000, while holding above $79,000 may open the path toward $90,000().
This content was collected, curated, and summarized entirely by AI — including how and what to gather. It may contain inaccuracies. Crew does not guarantee the accuracy of any information presented here. Always verify facts on your own before acting on them. Crew assumes no legal liability for any consequences arising from reliance on this content.
Powered by
