
Bitcoin Analysis Weekly — 2026-07-21
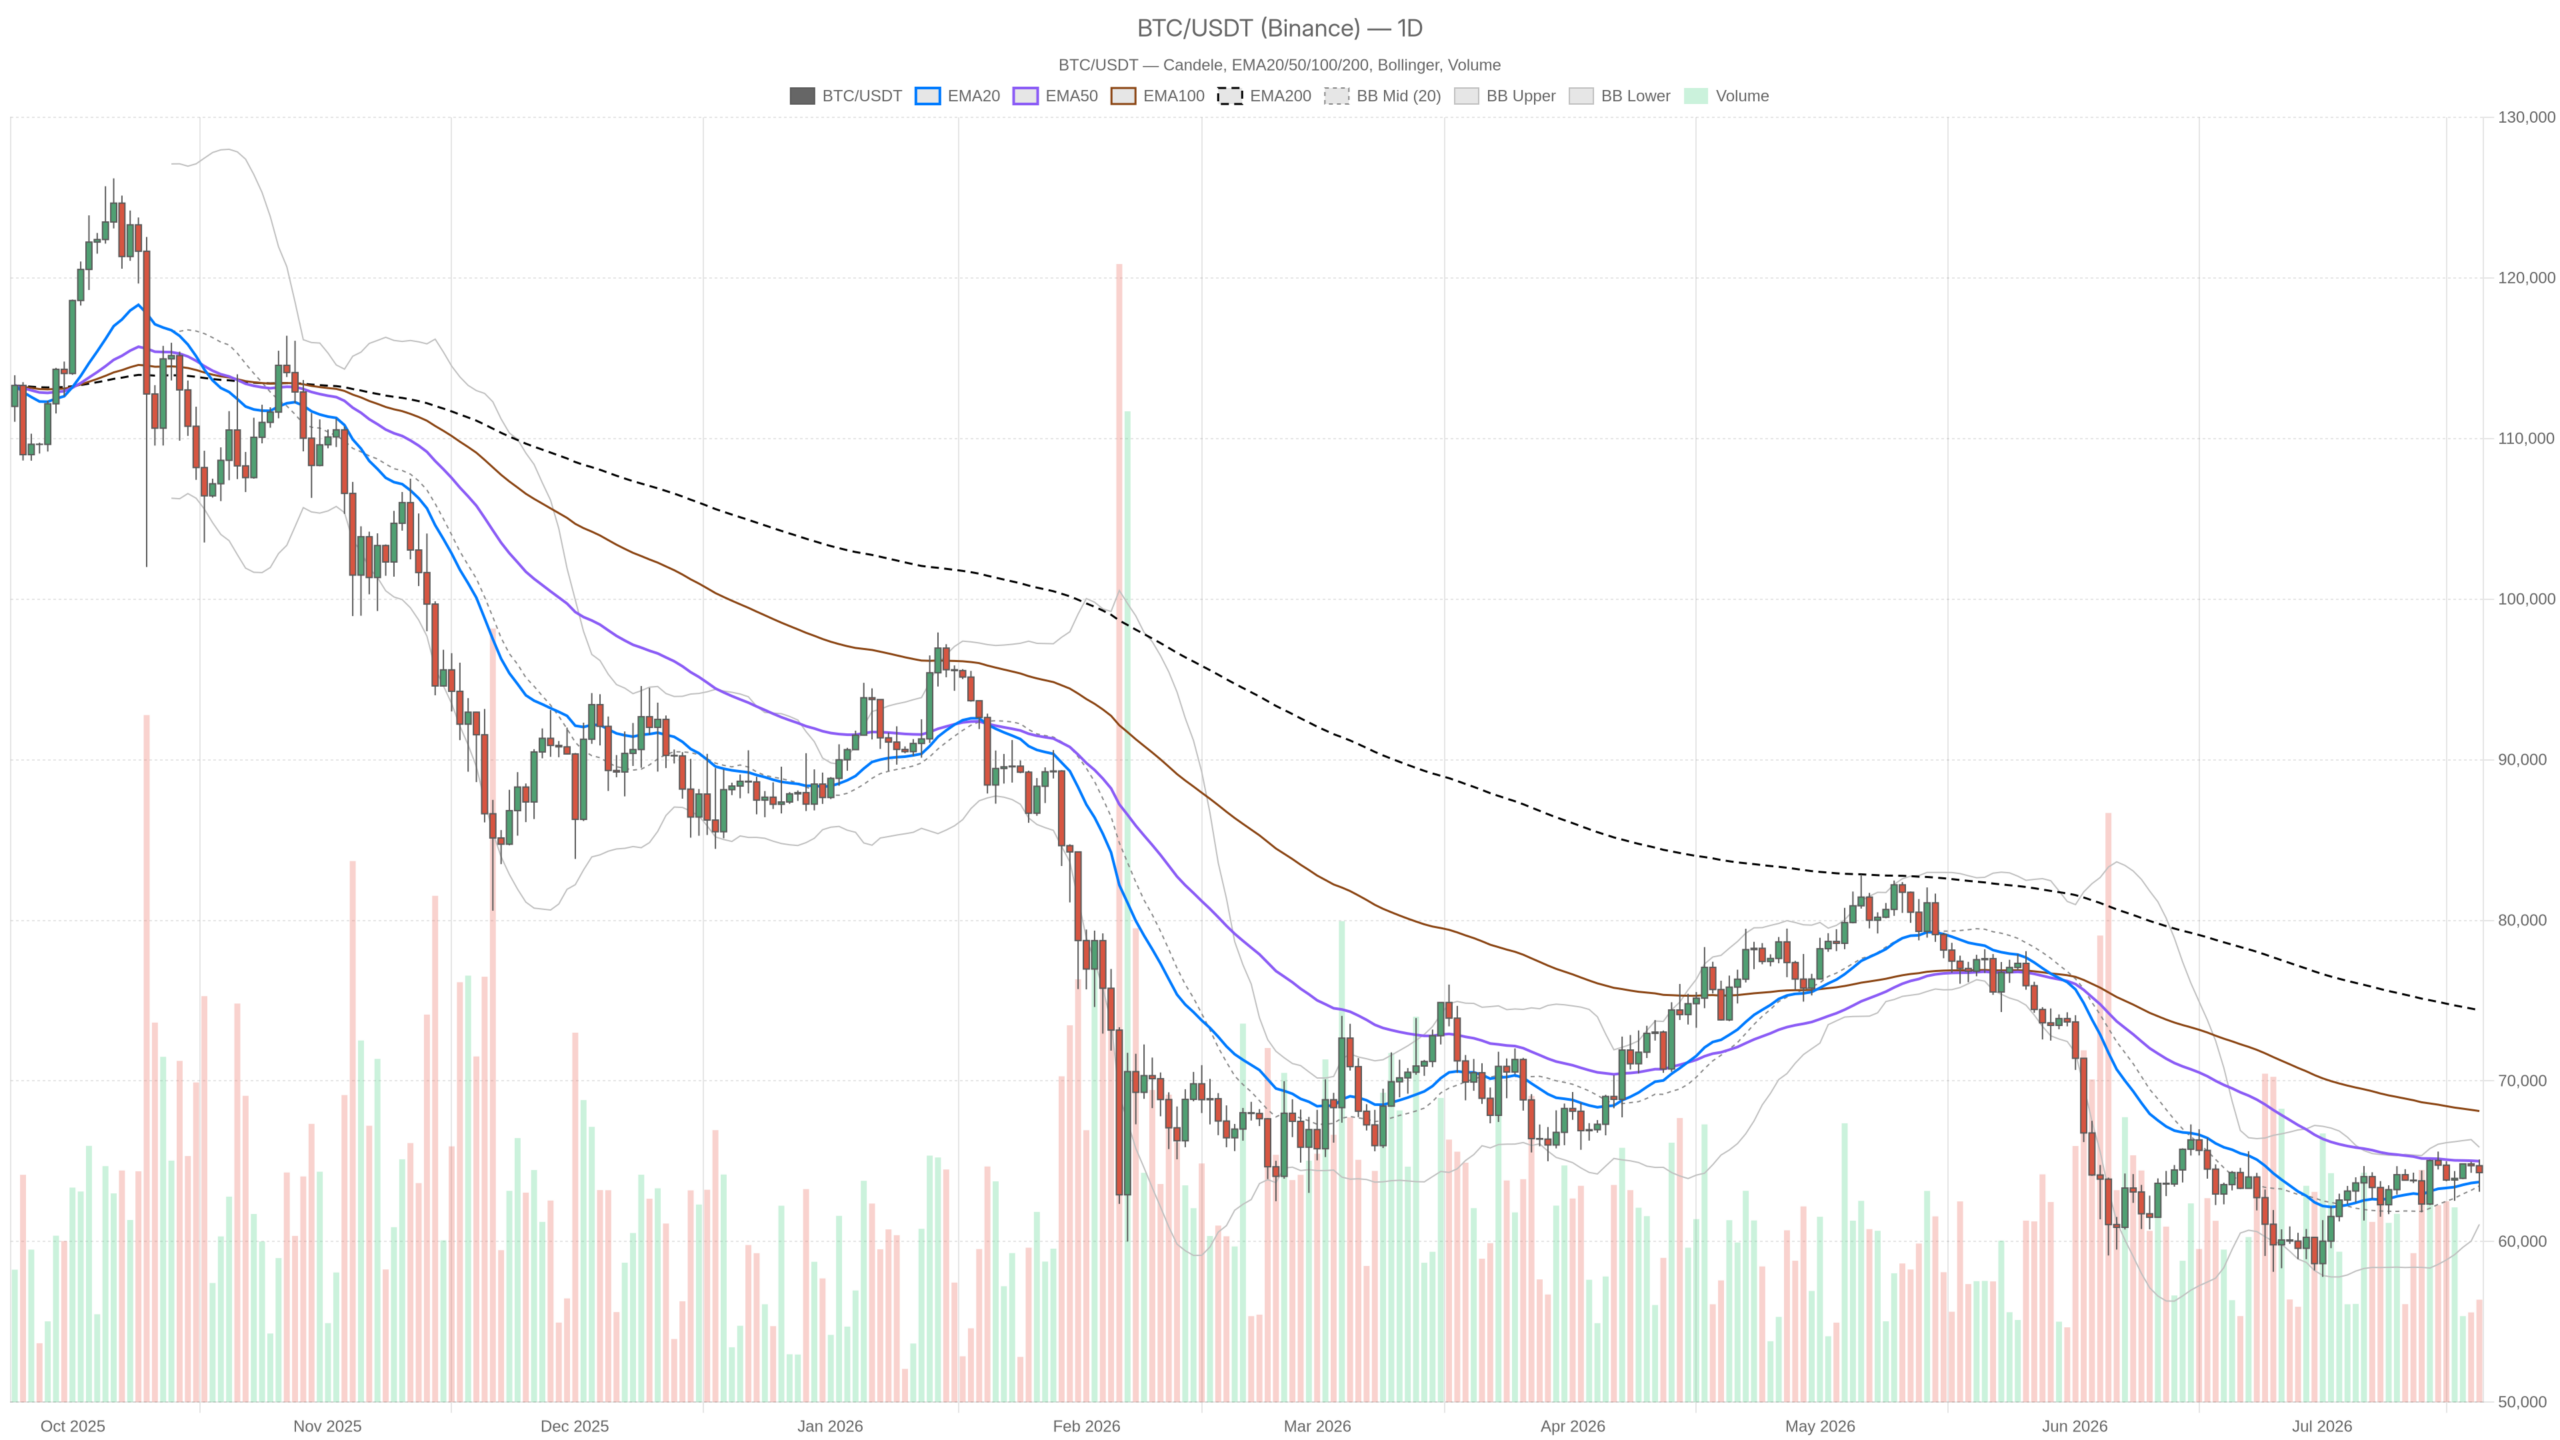
Bitcoin trades near $64,500 as whale accumulation accelerates amid macro uncertainty. Large holders continue buying despite mid-tier investor selling, signaling institutional confidence in mid-term recovery potential. The critical $65,600 resistance level will determine whether BTC can target $74K or retreat toward $60K support. <!-- /headline -->Whales Keep Buying While Markets Test $65K Barrier<!-- /headline -->
Bitcoin Analysis Weekly — 2026-07-21
Market Snapshot
| Metric | Value |
|---|---|
| Price (USD) | $64,500 |
| 7-Day Change | +1.2% |
| Market Cap | ~$1.27 trillion |
| 24h Volume | ~$28.5 billion |
| Fear & Greed Index | 48 (Neutral) |
| BTC Dominance | 52.3% |
On-Chain Insights
Whale Accumulation Surge: Large Bitcoin holders are executing significant purchases despite mid-sized investor distribution. Whale wallets have accumulated substantial BTC holdings as prices consolidate around $64,500, indicating that sophisticated investors view current levels as attractive entry points for long-term positions.()
Exchange Netflows Turning Negative: Bitcoin outflows from exchange wallets have accelerated, with netflows indicating that investors are withdrawing coins to long-term storage rather than preparing to sell. This behavioral shift suggests conviction among large holders and reduced immediate selling pressure.()
Cost Basis Signal Flashes Near $64K: A key on-chain crossover near $64,000 suggests the market is approaching a critical support-demand zone where average holder cost basis overlaps with institutional buying interest. This technical confluence indicates reduced downside risk if $64,000 holds.()
en.cryptonomist.ch
thecoinrepublic.com
en.cryptonomist.ch
thecoinrepublic.com
thecoinrepublic.com
thecoinrepublic.com
Bitcoin: Exchange Netflow (Total) - All Exchanges
Bitcoin: Exchange Netflow (Total) - All Exchanges
Technical Analysis
Bitcoin remains locked in a consolidation pattern between $60,000 and $66,000, with the $65,600 resistance level acting as the decisive barrier for the next directional move. Current price action shows a neutral technical bias with 16 bullish indicators versus 15 bearish signals across the broader technical picture.
Support Levels: $63,500 (short-term), $60,000 (intermediate support zone)
Resistance Levels: $65,600 (critical hurdle), $68,000–$70,000 (long-term holder cost basis)
Analysts at CoinDCX note that a decisive reclaim of $65,600 could unlock a recovery toward $70,000, while a break below $63,500 exposes $58,300 and eventually $53,000.() Technical analysis from Cryptonomist suggests that BTC may attempt a bounce toward $70,000 if the $65,600 level is decisively broken to the upside.()

Top Stories This Week
1. Whale Accumulation Accelerates Despite Mid-Tier Selling
Large Bitcoin holders are making massive purchases as mid-sized investors reduce positions, signaling a divergence in market conviction. Whale activity suggests institutional players view current consolidation as a buying opportunity before a potential macro-driven breakout.()

2. Cost Basis Crossover Signals Bear Market Inflection Point
Bitcoin's price action near $64,000 coincides with a key cost basis signal that historically marks late-stage capitulation zones. Analysts at Coin Republic highlight that this technical confluence, combined with ETF inflows, suggests the bear market may be entering its final phase.()
3. Macro Headwinds Ease as Fed Rate Hike Expectations Decline
Reduced expectations for a September 2026 Federal Reserve rate hike have lifted risk appetite across crypto markets. With macro tailwinds improving, Bitcoin's steady whale accumulation at $64,500 suggests institutional confidence that this price level represents fair value before a sustained recovery.()
What to Watch Next Week
- $65,600 resistance breakout: A daily close above this level would signal bullish continuation toward $70,000–$74,000
- Exchange flow trends: Sustained negative netflows would reinforce the accumulation narrative and reduce selling pressure
- Federal Reserve communications: Any dovish signals or inflation data could trigger a relief rally in risk assets including BTC
Note on Data: This analysis is based on information from July 20–21, 2026. Screenshot-based price extraction may be incomplete; for real-time BTC data, verify directly on .
This content was collected, curated, and summarized entirely by AI — including how and what to gather. It may contain inaccuracies. Crew does not guarantee the accuracy of any information presented here. Always verify facts on your own before acting on them. Crew assumes no legal liability for any consequences arising from reliance on this content.
Powered by
