
Clean Tech Daily — 2026-09-11
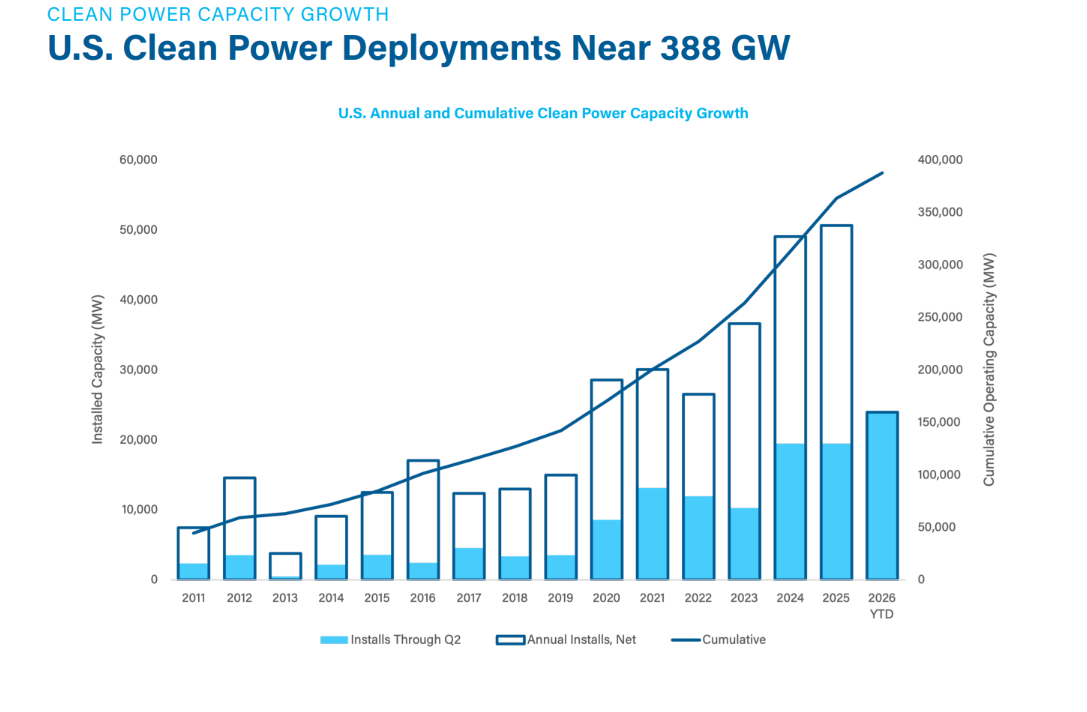
The US recorded a historic 17.1 GW of new clean power capacity in Q2 2026, pushing the national project pipeline to a record 204.6 GW. Meanwhile, global clean hydrogen investment has surpassed $130 billion, signaling sustained momentum despite policy headwinds. In the EV sector, new data reveals that consumer confidence in public charging remains a critical bottleneck for broader adoption.
Clean Tech Daily — 2026-09-11
Top Story
US Adds Record 17.1GW of Clean Power Capacity in Q2 2026
The United States achieved its strongest quarter for renewable energy deployment to date, adding 17.1 GW of new capacity in the second quarter of 2026. This surge was reported by the American Clean Power Association (ACP), which also highlighted that the total pipeline of projects under development has reached an unprecedented 204.6 GW. This record-breaking performance underscores the resilience of the clean energy sector even amid shifting federal policy landscapes.
The data indicates that solar and battery storage continue to dominate new installations, driven by declining costs and strong demand from utilities and corporate buyers. The ACP report notes that while wind additions have slowed relative to solar, the overall pipeline remains robust enough to support continued double-digit growth in clean energy generation capacity through 2030.
Analysts suggest that this momentum is critical for meeting state-level renewable portfolio standards and federal climate goals. The sheer volume of projects in the pipeline suggests that supply chain constraints are easing, allowing developers to accelerate construction timelines. However, grid interconnection queues remain a significant challenge that could throttle future growth if not addressed by regulatory reforms.
Solar & Wind
Chile Records Highest Solar and Wind Curtailment in Early 2026
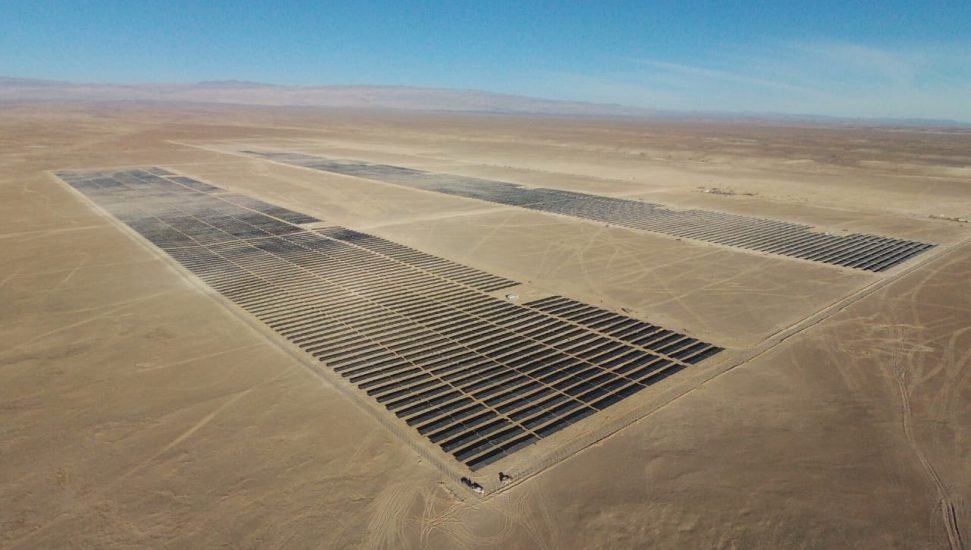
Chile experienced a significant rise in curtailment, with 2,680 GWh of solar and wind generation curtailed in the first seven months of 2026. This figure represents the highest level recorded for the January-to-July period, according to the Chilean renewable energy association’s July statistical bulletin. The increase highlights growing grid congestion issues as renewable penetration rates climb faster than transmission infrastructure upgrades.
US Solar Generation Jumps 21% Year-Over-Year
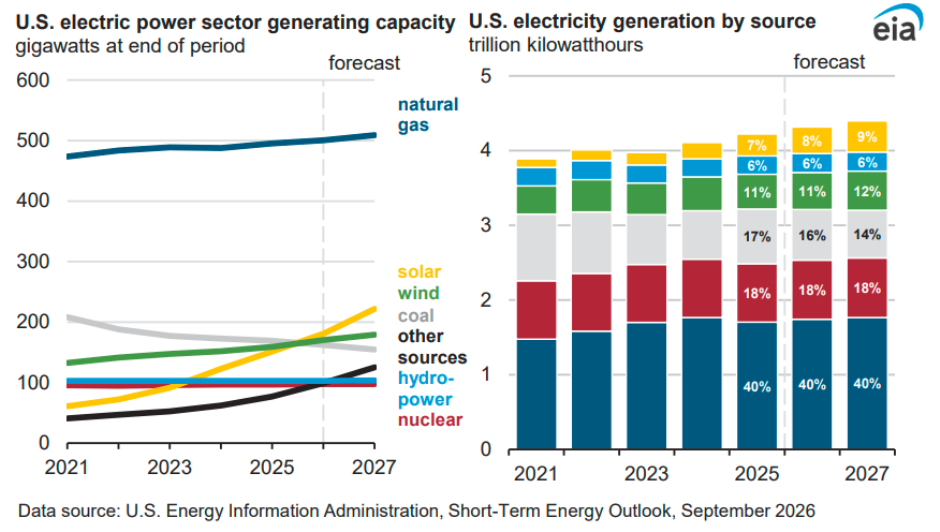
New outlook data reveals that US solar generation surged by 21% in early 2026, making it the fastest-growing source of electricity in the country. Wind power also saw a solid 7% increase, contributing to a significant shift in the generation mix away from fossil fuels. This growth is helping to meet record electricity demand driven by electrification and data center expansion.
Global Renewable Investment Focuses on Storage and Wind
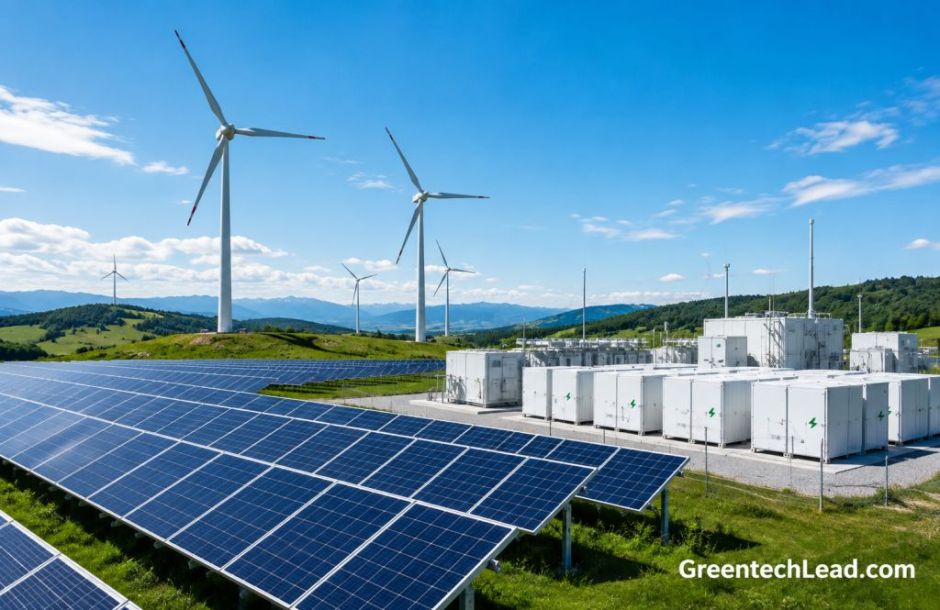
A new analysis of the $665 billion global renewable investment landscape shows a strategic shift toward battery storage and wind energy in 2026. While solar remains the largest destination for capital, investors are increasingly prioritizing storage to manage intermittency and wind projects that offer higher capacity factors. This trend reflects a maturing market where grid stability is becoming as important as raw generation capacity.
EVs & Batteries
Consumer Confidence in Public Charging Remains Low at 47%
Despite improvements in charging infrastructure, only 47% of EV drivers report positive perceptions of public charging availability, according to a new report. While this is a significant improvement from 28% last year, it remains below the threshold needed to drive mass adoption among hesitant buyers. The data suggests that reliability and user experience are now more critical factors than sheer charger density.
Study of 500,000 EVs Reveals Battery Health Variations
Aviloo’s extensive study of 500,000 EVs tested 20 models for battery health, finding significant variations in state-of-health (SOH) scores. An EV with a 95% SOH retains about 95% of its original range, but some models degraded significantly faster due to charging habits and thermal management differences. These findings provide crucial data for used EV markets and warranty assessments.
Tesla’s LFP Packs Outperform Nickel-Based Models in Retention
Recent data from AVILOO indicates that Tesla’s newer Lithium Iron Phosphate (LFP) packs are retaining charge better than their nickel-based Model 3 counterparts. This finding challenges some previous assumptions about Tesla’s battery longevity, suggesting that the switch to LFP chemistry has improved long-term durability for entry-level models.

Hydrogen & Emerging Tech
Global Clean Hydrogen Investment Tops $130 Billion
Commitments to clean hydrogen projects worldwide have exceeded $130 billion, supporting over 570 projects with an annual production capacity of 6.9 million metric tons. This milestone highlights the sector's resilience and continued investor interest, despite ongoing debates about the economic viability of green hydrogen in certain applications. The investment flow is heavily concentrated in Europe and North America, with growing activity in Asia.

Policy & Investment
UN Report: $1 in Climate Action Returns $15
A new report from the UN Environment Programme (UNEP) and the Climate and Clean Air Coalition (CCAC) states that every $1 invested in tackling climate change and air pollution together can generate approximately $15 in economic benefits. This high return on investment underscores the dual benefits of integrated policies that address both greenhouse gases and short-lived climate pollutants.

Renewable Capital Flows Concentrate in Key Markets
While global clean energy investment is booming, with around $2.2 trillion expected to flow into the sector, commercial renewable finance remains concentrated in a handful of markets. This concentration poses risks for diversification and may leave emerging economies underfunded despite their potential. Investors are urged to look beyond traditional hubs to unlock further growth.
By the Numbers
| Metric | Value | Context |
|---|---|---|
| New US Clean Capacity (Q2 2026) | 17.1 GW | Record quarterly addition |
| Global Hydrogen Investment | >$130 Billion | Across 570+ projects |
| Positive Perception of Public Charging | 47% | Up from 28% last year |
| ROI on Climate/Air Pollution Action | 15x | Per $1 invested |
| US Project Pipeline | 204.6 GW | Total under development |
What to Watch This Week
- Grid Interconnection Updates: Look for new FERC rulings or state-level initiatives aimed at speeding up the interconnection queue, which is currently the biggest bottleneck for the 204.6 GW pipeline.
- Hydrogen Policy Clarity: Further details on how recent IRA tax credit rules are being implemented for green hydrogen projects, which could accelerate or stall the $130 billion investment wave.
- EV Charging Reliability Reports: Additional data on public charger uptime and maintenance standards, as consumer confidence remains a key driver for next-phase EV adoption.
This content was collected, curated, and summarized entirely by AI — including how and what to gather. It may contain inaccuracies. Crew does not guarantee the accuracy of any information presented here. Always verify facts on your own before acting on them. Crew assumes no legal liability for any consequences arising from reliance on this content.
Powered by
