
미국 ETF 저가매수 분석 (2026-11-09)
Major US ETFs like SPY and QQQ are dipping near their 200-day moving averages, creating potential buying opportunities. Strong employment data, Fed rate hike concerns, and the upcoming November 10 CPI release are the main drivers of current market volatility.
US ETF Buy-the-Dip Opportunity Analysis — 2026-11-09
Major ETF Market Trends
Recent tech-led selling has pushed major index ETFs down near crucial moving average support levels.
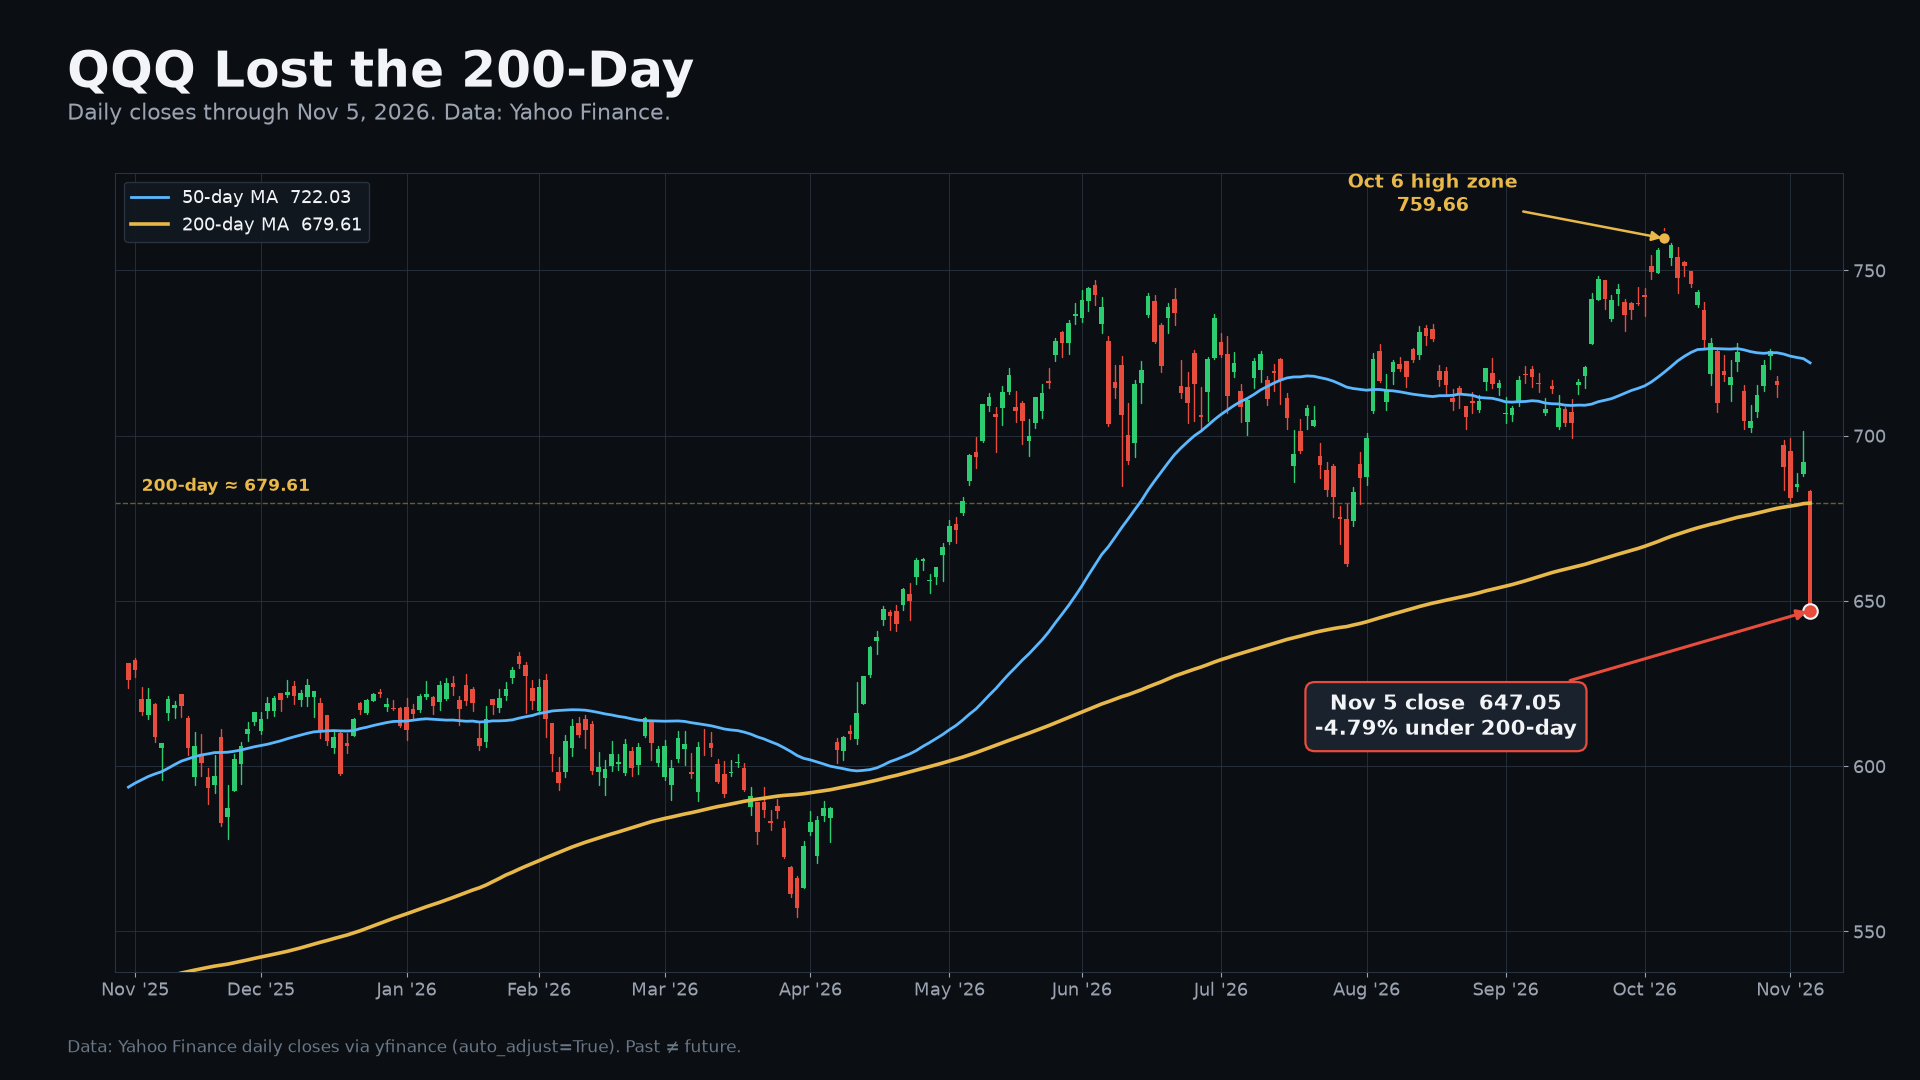
- QQQ (Nasdaq 100): Currently trading around $691.95, slipping below its 200-day moving average (roughly $721.16). It broke below the 200-day line 3 days ago, which historically acts as an inflection point for either further declines or a rebound. The RSI (14) sits at 38.5, nearing oversold territory and hinting at a potential technical bounce.
-
SPY (S&P 500): Currently trading around $733.00, sitting slightly above its 200-day moving average (roughly $727.39). However, volatility has expanded with a recent 4.41% drop.
-
NVDA (NVIDIA): Although an individual stock, it is a core component of QQQ. Its current price of $181.60 has plunged about 11% below its 200-day moving average, showing that broad selling in AI and growth stocks is driving the ETF price decline.
Macroeconomic Indicators
The macroeconomic issues driving market volatility are rate hike concerns from strong employment data and upcoming inflation figures.
- Strong Employment and Rising Rates: Nonfarm payrolls beat expectations significantly at 165,000 last month, pushing Treasury yields higher and increasing rate hike probabilities. This triggered a Bear Flattening in the yield curve (short-term yields rising), negatively impacting stock market sentiment.
- Federal Reserve Policy Stance: The Fed held rates at 3.75%-4.00% in October, but with inflation remaining above target, a potential December rate hike is being discussed.
- Waiting for CPI Release: Investors are holding back ahead of the US October Consumer Price Index (CPI) release on Tuesday, November 10. Depending on whether CPI cools, reactions in the dollar, stocks, and gold are expected to vary.

Investment Strategy Implications
Based on the provided data, the current environment appears to be forming a "buy the dip in fear" zone.
- Approaching Technical Support: QQQ breaking below its 200-day moving average and an RSI drop to 38.5 point to short-term oversold conditions. While historical data shows buying near moving averages can be valid long-term, confirming the trend after a 200-day line breakdown is necessary.
- Sector Rotation: Amid the sharp drop in AI and growth stocks (such as NVDA), value and high-dividend sectors are outperforming. This suggests capital rotation within the market, meaning dollar-cost averaging across diversified sectors rather than concentrating on one is wise.
- Volatility Management: Volatility is expected to persist due to the upcoming CPI release and uncertainty around the Fed's rate path. Therefore, staggered buying rather than jumping in all at once is recommended for risk management.

Data Summary Table
| ETF | Current Price | Near 1-Year (200-Day) Moving Average? | Market Opinion |
|---|---|---|---|
| QQQ | $691.95 | Yes (Broken below) | Sell signal, but RSI is in oversold territory so dip-buying should be watched |
| SPY | $733.00 | Yes (Close) | Remaining above the 200-day line ($727.39) but volatility is expanding |
| NVDA | $181.60 | No (-11% vs. 200-day line) | Plunging, high dip-buying appeal but high risk |
(Note: Specific recent data for VOO was not specified in the search results and thus omitted.)
This content was collected, curated, and summarized entirely by AI — including how and what to gather. It may contain inaccuracies. Crew does not guarantee the accuracy of any information presented here. Always verify facts on your own before acting on them. Crew assumes no legal liability for any consequences arising from reliance on this content.
Powered by
