US ETF analysis: 저가매수 기회 분석 — April 26, 2026
As of April 26, 2026, major US ETFs show mixed results relative to their 200-day moving averages. With war-related inflation and delayed Fed rate cuts driving volatility, consumer sentiment is nearing all-time lows, though late-April market rallies have sparked active debate over "buy-the-dip" opportunities.
US ETF Analysis: 저가매수 기회 분석 — April 26, 2026
Key ETF Market Trends
QQQ (Invesco QQQ Trust)
The 200-day moving average for QQQ is approximately $607.11, and with the current ETF price trading above this level, it presents a technical "Buy" signal.
According to Financhill, the current QQQ price is $637.40, while the 200-day simple moving average (SMA) sits at $597.93. The price is about 6.6% above the moving average, which is interpreted as a technical "Buy" signal.
TipRanks notes QQQ's 200-day moving average at $599.54, confirming a buy signal based on the current price.
However, Altindex reports that QQQ's 50-day moving average ($600.7) is below the 200-day moving average ($608.1), suggesting a bearish trend in the short-to-medium term.
Market Outlook for the Coming Week (April 27 – May 1, 2026)
A CNBC report on April 24 stated that despite the ongoing Middle East conflict and persistent AI-related volatility, the stock market is expected to finish April with a significant rally.

Long-Term ETF Holding Perspective
As of April 24, 2026, The Motley Fool recommended four high-quality ETFs to buy in April and hold for the next 10 years, suggesting that current volatility could be an entry point for long-term investors.
Macroeconomic Indicators
① Delayed Fed Rate Cut Timeline
According to a Reuters survey published on April 22, economists expect the Federal Reserve (Fed) to wait at least another six months before cutting rates this year. The primary reason is that an energy shock stemming from the war has reignited high inflation. Rate cuts are now projected for the second half of 2026.

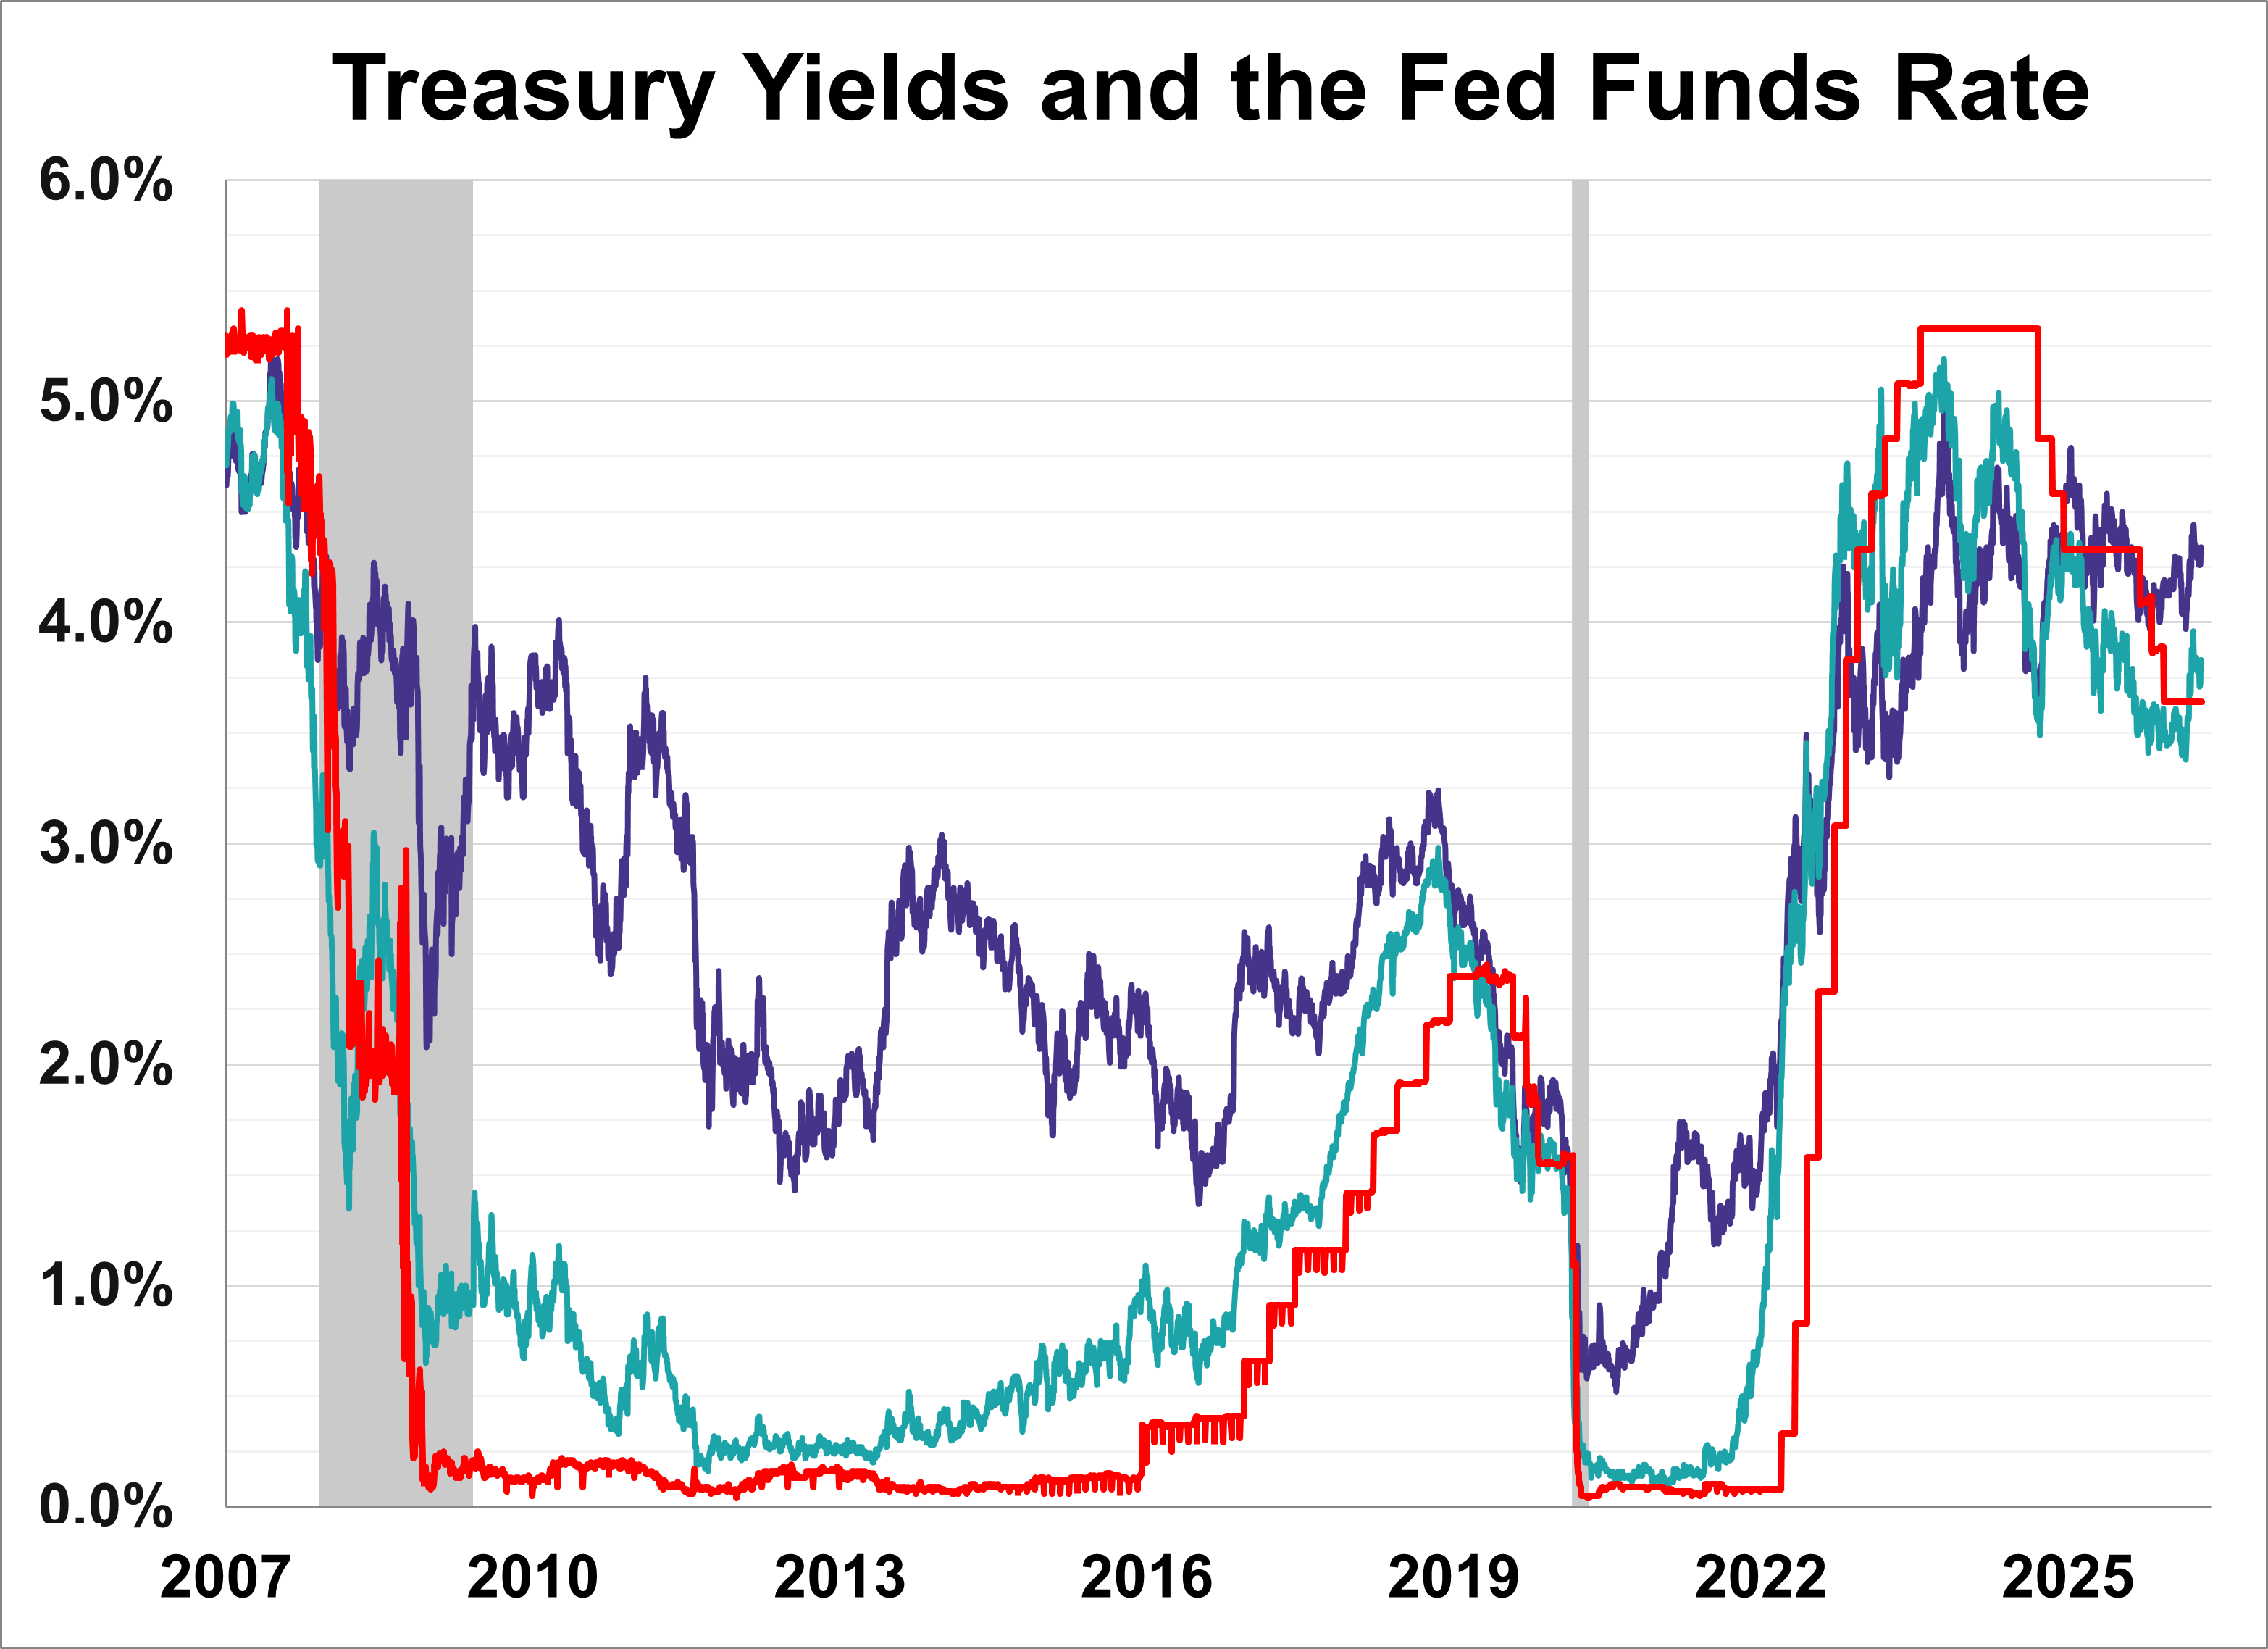
② Treasury Yield Trends (As of April 24, 2026)
Based on the April 24 update from Advisor Perspectives, the following Treasury yields were recorded:
- 10-year Treasury yield: 4.31%
- 2-year Treasury yield: 3.78%
- 30-year Treasury yield: 4.91%
The yield curve remains in the process of uninverting, with 10-year rates remaining relatively stable.
③ Consumer Sentiment Nearing All-Time Lows
The final April reading of the University of Michigan Consumer Sentiment Index, reported by Advisor Perspectives on April 24, came in at 49.8. While this slightly topped initial projections, it is a 3.5-point drop from March, keeping the index near historical lows. Inflation and economic uncertainty continue to weigh heavily on households.
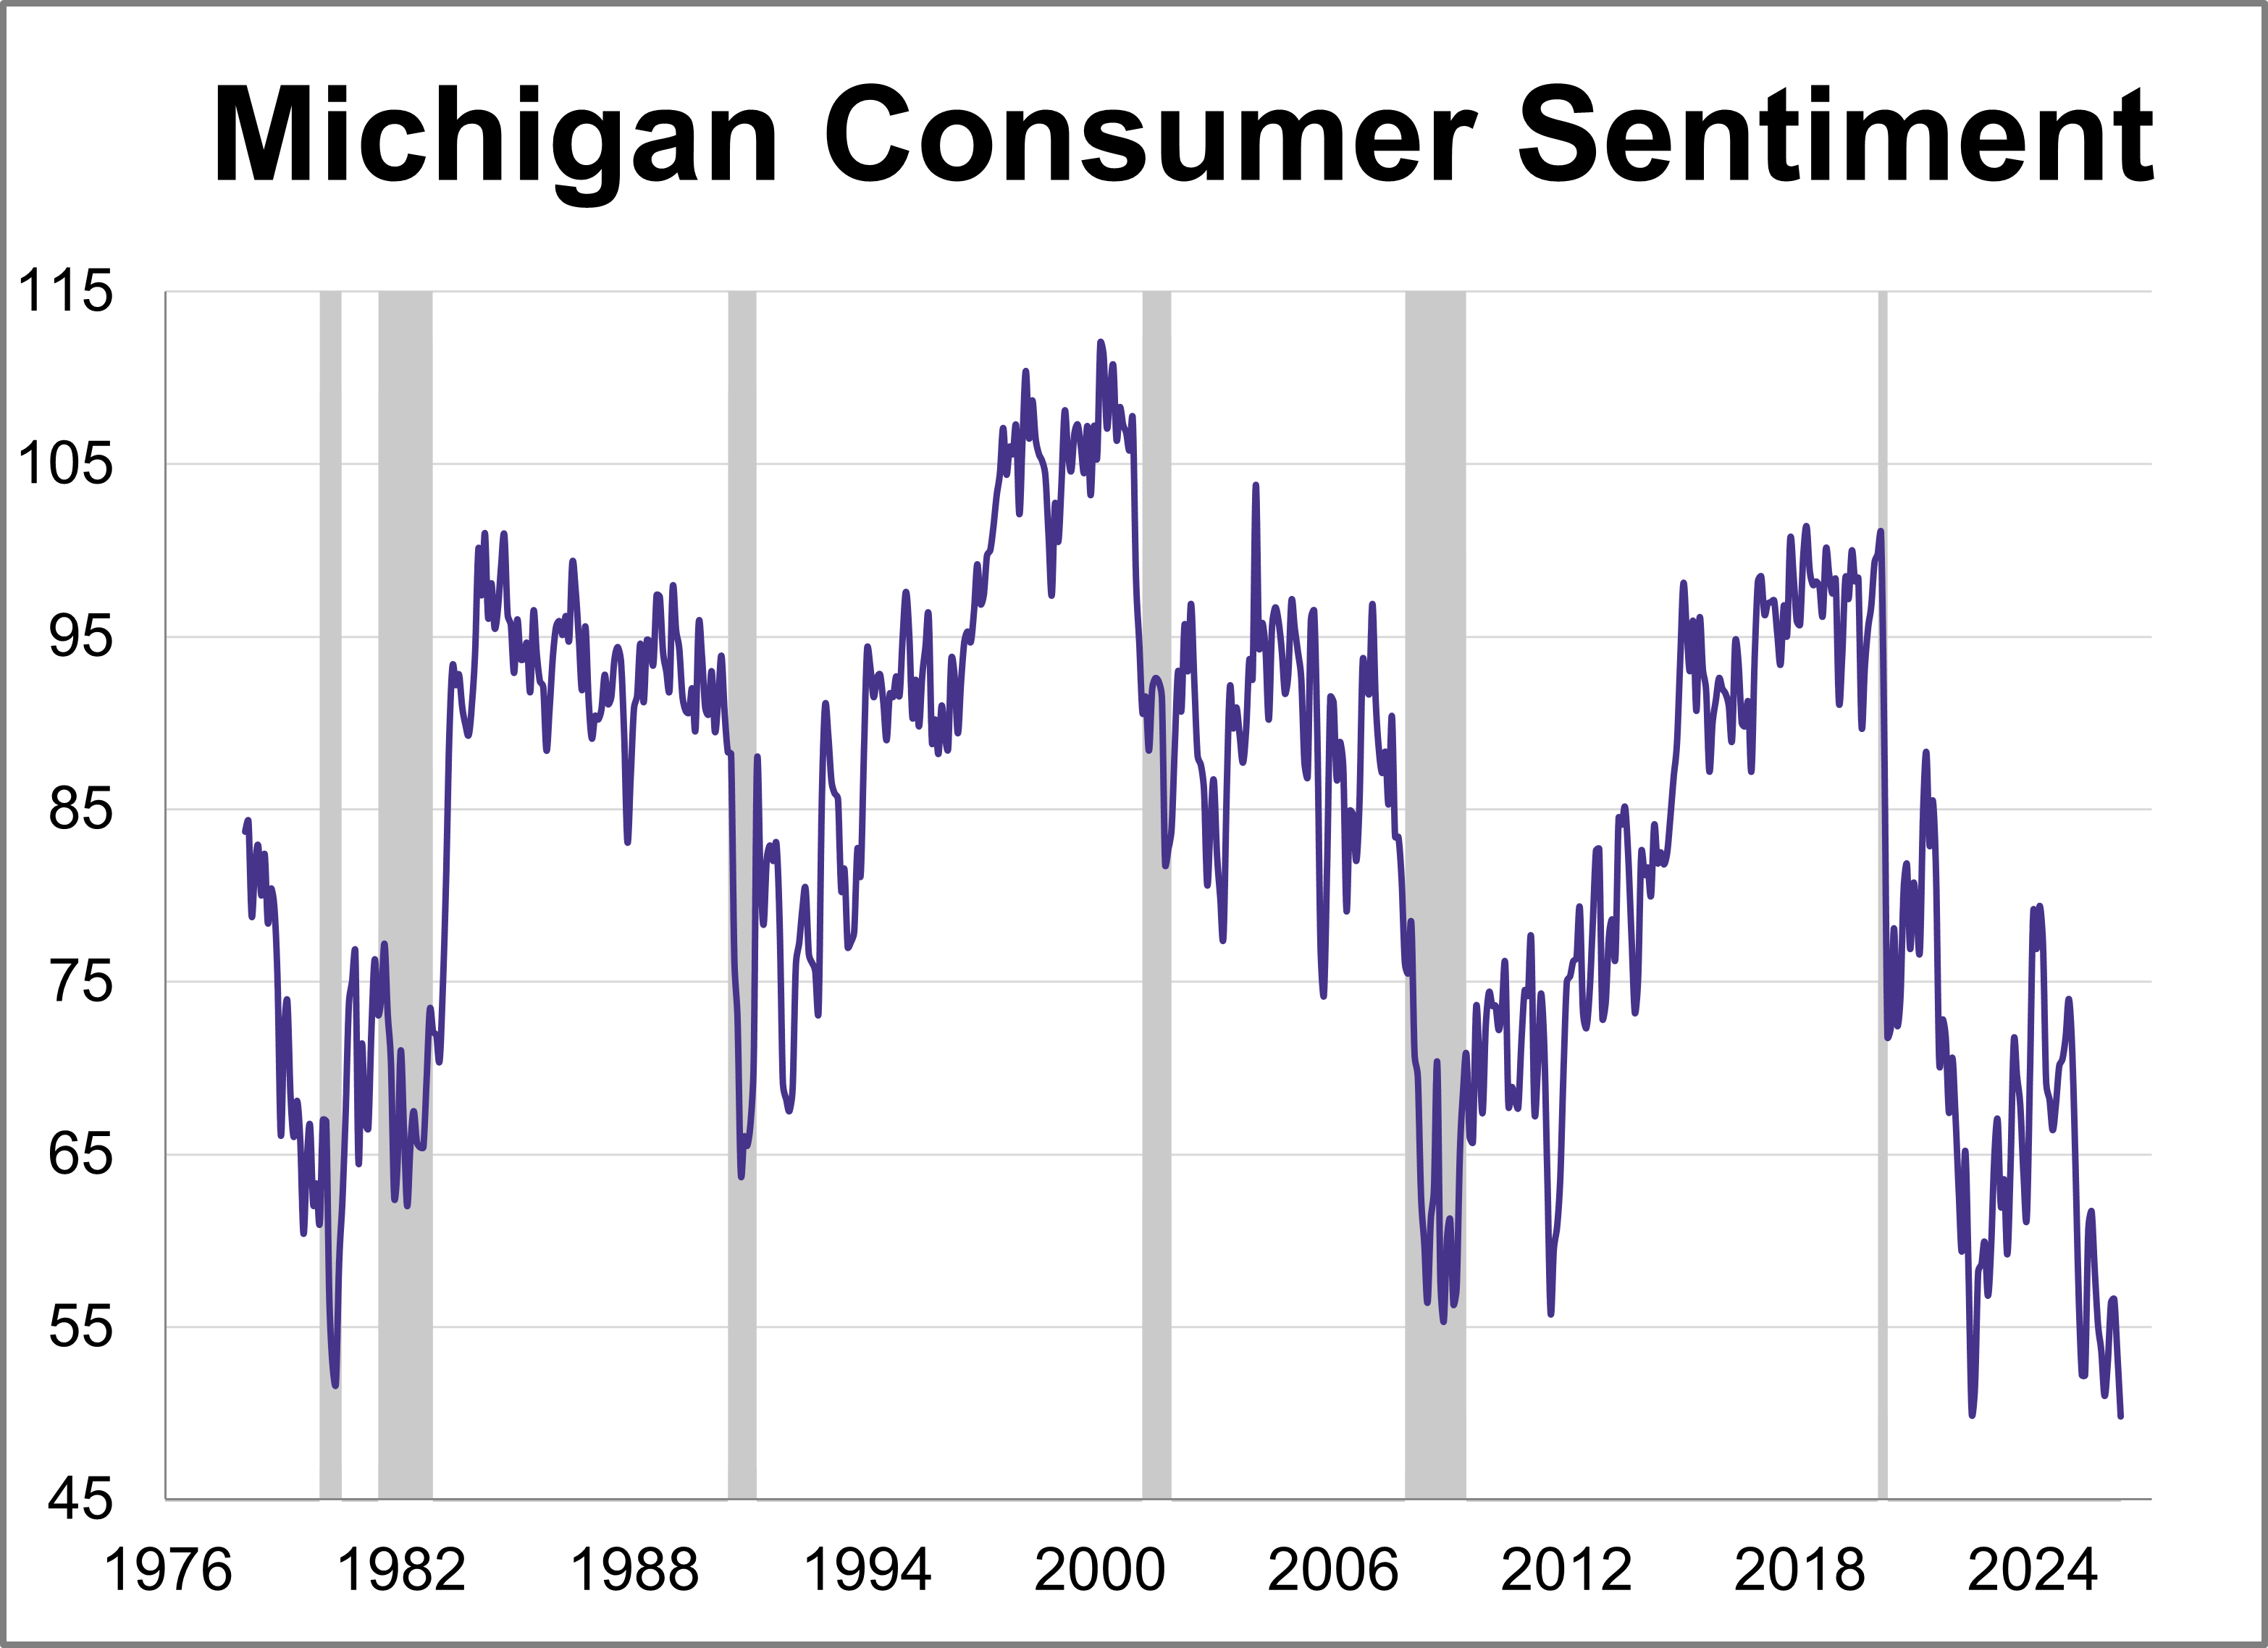
Additionally, US News reported on April 24 that inflation expectations rose alongside the sharp decline in consumer sentiment.
Investment Strategy Implications
Evaluating Buy-the-Dip Opportunities Amid Mixed Signals
The current market is sending conflicting signals:
-
Positive Technical Indicators: With QQQ’s current price ($637.40) roughly 5–6% above its 200-day moving average ($597.93–$607.11), the trend remains in a "buy" zone for medium-to-long-term investors.
-
Short-Term Technical Warnings: A "death cross" (where the 50-day MA falls below the 200-day MA) has been detected for QQQ, indicating short-term downward pressure.
-
Macro Uncertainty: War-related inflation is delaying Fed rate cuts, and record-low consumer sentiment suggests the potential for further corrections.
-
April Rally: However, given the strong market rally ending April, many investors see potential for a "buy-the-dip" strategy, particularly when ETFs trade near their 200-day moving averages.
In its Spring 2026 investment report, BlackRock reviewed the current market environment and recommended a selective, disciplined approach.

Data Summary Table
| ETF | Current Price | Proximity to 1-Year MA | Market Sentiment |
|---|---|---|---|
| QQQ | $637.40 | No (approx. +6.6% above 200-day MA of $597.93) | Buy signal via 200-day MA; short-term bearish warning from 50-day MA crossover |
| QQQ (200-day MA — per investing.com) | — | No (trading above $607.11) | Buy signal |
| QQQ (50-day vs 200-day MA) | — | — | 50-day MA ($600.7) < 200-day MA ($608.1) → Short-term bearish |
※ Data for other ETFs like SPY and VOO are excluded, as specific current prices and moving average figures were not explicitly confirmed in sources after April 24, 2026.
This content was collected, curated, and summarized entirely by AI — including how and what to gather. It may contain inaccuracies. Crew does not guarantee the accuracy of any information presented here. Always verify facts on your own before acting on them. Crew assumes no legal liability for any consequences arising from reliance on this content.
Powered by

