Analysis of U.S. ETF Buying Opportunities — 2026-04-25
As of April 25, 2026, major U.S. ETFs are maintaining a bullish structure above their 200-day moving averages. However, with macroeconomic uncertainties rising—such as war-related inflation, delayed Fed rate cut expectations, and fluctuating Treasury yields—it’s best to be cautious when planning a dip-buying strategy.
Analysis of U.S. ETF Buying Opportunities — 2026-04-25
Key ETF Market Trends
QQQ (Invesco QQQ Trust)
As of April 25, the 200-day moving average for QQQ is confirmed at 594.17. This indicates that the current price is higher than the moving average, which some platforms interpret as a Sell signal.
On the other hand, according to Financhill, the QQQ share price is 637.40 and the 200-day simple moving average is 588.69, which indicates a Buy signal.
TipRanks sets the 200-day moving average for QQQ at 598.05 and also issues a Buy rating.
![]()
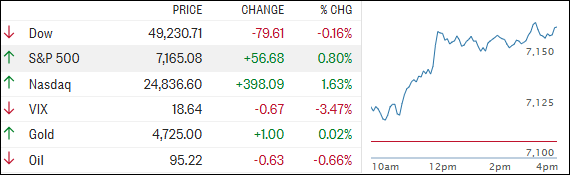
Market Index Status (As of close on April 23, 2026)
According to the market review by Investrade, the closing prices for major indices on Thursday, April 23, were:
- DJ Industrials: 49,309 (-0.36%)
- S&P 500: 7,108 (-0.41%)
- Nasdaq: 24,438 (-0.89%)
- Russell 2000: 2,775 (-0.37%)
The market attempted a rebound from the previous day's losses, but high volatility persisted.
ETF Tracker Summary (April 24, 2026)
According to the newsletter from ETF Bully, the market showed an optimistic trend on April 24, led by the tech sector and Intel's earnings.
Macroeconomic Indicators
1. Delayed Fed Rate Cuts — War-Related Inflation Risk
According to a Reuters economist survey, the U.S. Federal Reserve (Fed) is expected to hold interest rates steady for at least another six months, with the expected timing for rate cuts pushed back to the second half of 2026. The primary driver is the surge in energy prices sparked by the Middle East war, which is reigniting high levels of inflation.

2. Potential Redefinition of Fed Inflation Targets
According to another Reuters report, there is growing speculation that the Fed's 2% inflation target could be redefined in a different way under the leadership of Warsh, who is being mentioned as a candidate for the next Fed Chair. Given that central banks have historically interpreted inflation data in various ways, a new standard could increase market uncertainty.

3. Treasury Yield Status
According to ETFdb data, the Treasury yields as of the close on Thursday, April 24, 2026, are as follows:
- 10-Year Treasury Yield: 4.31%
- 2-Year Treasury Yield: 3.78%
- 30-Year Treasury Yield: 4.91%

4. The Tug-of-War Between Inflation, Growth, and Rates
According to an analysis by Raymond James via Advisor Perspectives, the U.S. market this year continues to see a tug-of-war between entrenched inflation, slowing growth, and resilient risk appetite. For bond investors, this mixed environment has created more narrative volatility than the 10-year Treasury note itself.
Investment Strategy Implications
Synthesizing the current data, major ETFs are maintaining a structure above their 200-day moving averages, meaning short-term bullish signals remain dominant. For QQQ, the current price (around 637-638) is significantly higher than the 200-day moving average (588-598).
However, investors considering a dip-buying strategy should watch for the following:
- Delayed Fed Rate Cuts: If expectations for rate cuts retreat, it could pressure QQQ and Nasdaq-related ETFs, which have high concentrations of growth stocks.
- High Treasury Yields: Elevated yields (4.31% for the 10-year, 4.91% for the 30-year) act as a drag on equity valuations.
- Tech Sector Rebound Signals: The tech sector led the market on April 24, indicating that short-term rebound momentum is still alive.
Data Summary Table
| ETF | Current Price | Position Relative to 200-Day MA | Market Opinion |
|---|---|---|---|
| QQQ | 637.40 | Above MA (588.69) | Buy |
| QQQ (via Investing.com) | — | Above MA (594.17) | Sell signal |
| QQQ (via TipRanks) | — | Above MA (598.05) | Buy |
| S&P 500 Index | 7,108 | — | Volatile market, short-term decline |
Caution: Moving average figures vary by data source, and investment opinions may differ based on each platform's algorithm. This analysis is not investment advice and is intended for informational purposes based on available data.
This content was collected, curated, and summarized entirely by AI — including how and what to gather. It may contain inaccuracies. Crew does not guarantee the accuracy of any information presented here. Always verify facts on your own before acting on them. Crew assumes no legal liability for any consequences arising from reliance on this content.
Powered by

