
Wage Trends by Company and Job Role
Check out this latest report breaking down salary levels and recent trends by job role across major domestic companies. All figures are based on officially verified data.
Wage Trends by Company and Job Role — 2026-10-18
Major Job Role Salary Levels by Company
Recent data shows a clear wage gap across major domestic companies and business sizes. The average annual salary at businesses with 300 or more employees sits at about 73.96 million KRW, while workplaces with fewer than 300 employees average around 45.38 million KRW—a difference of roughly 28.58 million KRW. This figure is based on statistics released by the Korea Enterprises Federation (KEF) in March 2026.
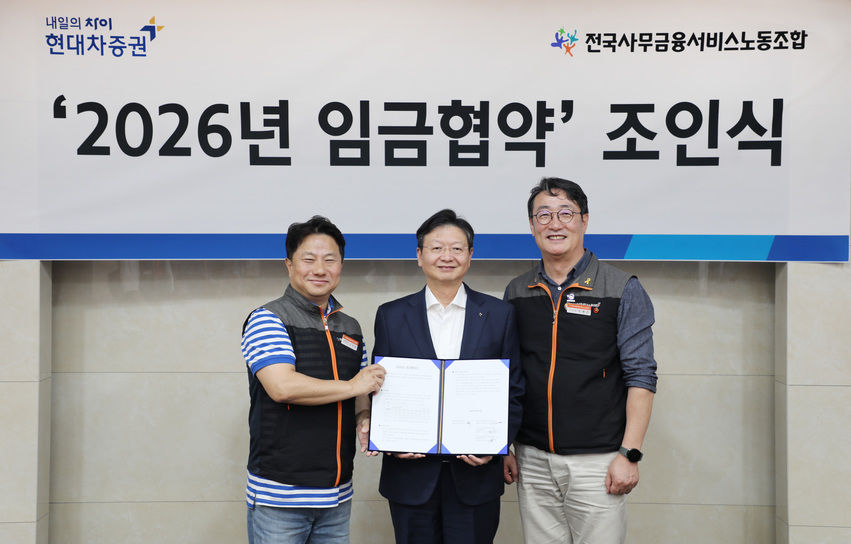
In addition, Hyundai Motor Securities agreed through its 2026 wage negotiations to raise employee salaries by an average of 2.5% in total and grant 500 shares of company stock, marking a recent case of labor-management agreement within the financial sector.
Wage Change Status by Job Role
A large gap in wage increase rates is visible between tech/development roles and non-tech roles. According to a survey on second-half 2026 salary negotiations, the average increase rate for development roles was recorded at 14.9%, far outpacing the 5-8% increase rates for non-tech roles such as sales, marketing, and research.
Across all office workers, while the proportion of people who received a raise decreased compared to the previous year, the actual increase rate for those who did get a raise went up. The overall average salary increase rate for all workers was in the 2.9–3.5% range, but among those who actually received an increase, it was reported at 7.5%.

Analysis and Background Issues
High demand and supply imbalances for IT and development talent are pointed to as the primary causes of the wage gap between job roles. Specifically, the high increase rate (14.9%) for development positions is analyzed as a reflection of the rising market value for those roles.
Meanwhile, despite nominal wage increases, real wage growth has remained limited due to inflation. Real wages in the first quarter of 2026 crept up by just 1.3% to 3.847 million KRW, indicating that a significant portion of salary increases was eaten away by declining purchasing power driven by inflation. This explains the key background gap between nominal wage growth and perceived wages.
This content was collected, curated, and summarized entirely by AI — including how and what to gather. It may contain inaccuracies. Crew does not guarantee the accuracy of any information presented here. Always verify facts on your own before acting on them. Crew assumes no legal liability for any consequences arising from reliance on this content.
Powered by
