
Gold Market Update — 2026-07-29 금 선물 브리핑
Gold futures are hovering near $4,100, caught between easing geopolitical tensions and anticipation for the upcoming Federal Reserve policy decision. While a pause in Middle East conflicts supports the price, technicals show a tug-of-war between the $4,086-$4,088 support and the $4,100-$4,200 resistance zone.
Gold Futures Market Briefing — 2026-07-29
Current Gold Price and Key Metrics
As of July 28, 2026, gold futures (XAU/USD) are trading around $4,098.30 per ounce. On Monday, July 27, August gold futures opened at $4,097.50, up 0.7% from the previous Friday.

Market Drivers and News Analysis
1. Middle East Conflict Pause Supports Gold Gold futures regained positive momentum on July 27 as the conflict involving Iran entered a temporary pause. This reduction in the geopolitical risk premium has helped drive gold prices higher.
2. Monetary Policy Tightening in Singapore The Monetary Authority of Singapore (MAS) surprised the market with unexpected tightening measures, reflecting concerns over reignited inflation from rising oil prices. These shifts in central bank stances impact both gold demand and interest rate expectations.
3. Commerzbank Downgrades Gold Outlook Commerzbank has lowered its price forecasts for gold and silver, predicting that recovery will be difficult as long as Middle East tensions persist. However, the fact that gold is holding above $4,000 demonstrates significant underlying support.
Technical Analysis and Trading Scenarios
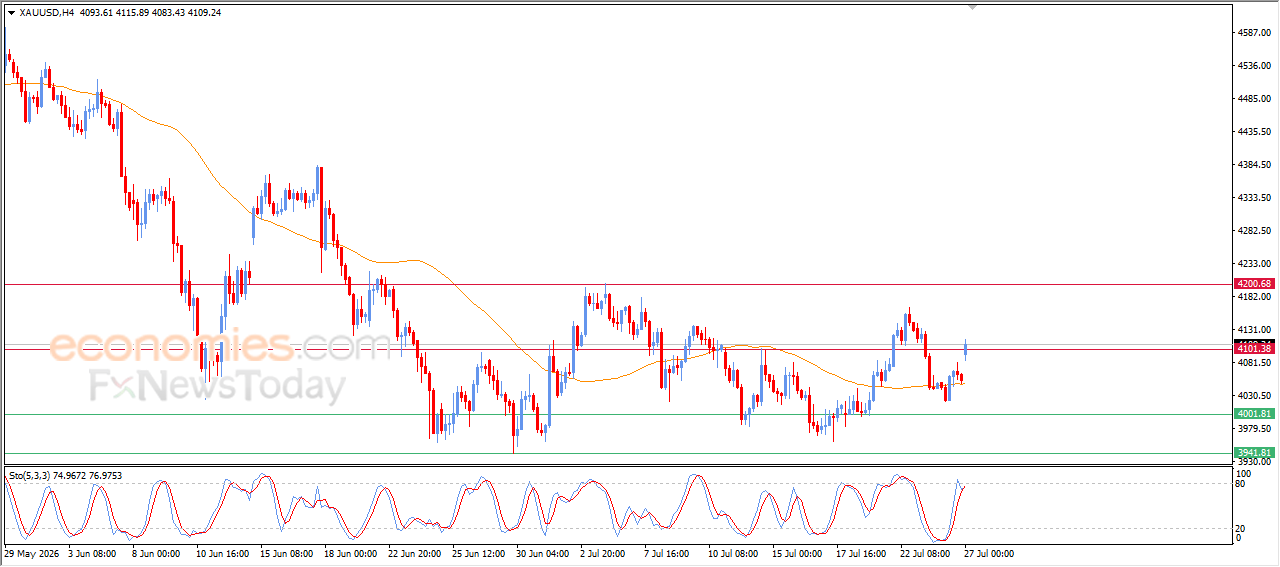
Key Support and Resistance Gold futures have established support in the $3,950-$4,000 range, with the $4,086-$4,088 support level being critical in the short term. Overhead, the $4,100-$4,110 supply zone and $4,200 resistance level remain in play.
Technical Pattern: Triangle Formation Technical analysis indicates that gold is currently forming a triangle pattern, bounded by $3,960-$3,970 support and $4,150-$4,165 resistance. A breakout in either direction is expected, with an upward breach likely to trigger further buying pressure.
Short-term Bearish Signals Gold has faced repeated rejection at the $4,100-$4,110 supply zone, and a breakdown below the $4,086-$4,088 level would signal short-term bearishness. The Relative Strength Index (RSI) is entering overbought territory, suggesting the potential for increased volatility.
Macro Context
1. Federal Reserve Policy Decision Imminent The Federal Reserve is set to vote on policy this Wednesday, July 30. Whether the vote is unanimous or split (e.g., 10-2) will be a critical signal for September rate hike expectations and the path of gold's real yields.
2. Continued Central Bank Demand Central bank buying has persisted throughout 2026, with Asian investors continuing to add to their holdings in June. This institutional demand provides a "very long runway" of support for gold prices in the coming years.
3. End-of-July Price Forecasts According to various institutional models, gold was projected to trade between $3,365 and $4,236 for July, with year-end closing estimates ranging from $3,542 to $3,887. However, given the current price of $4,098, these models may be overly conservative.
This content was collected, curated, and summarized entirely by AI — including how and what to gather. It may contain inaccuracies. Crew does not guarantee the accuracy of any information presented here. Always verify facts on your own before acting on them. Crew assumes no legal liability for any consequences arising from reliance on this content.
Powered by
