
Gold Futures Briefing: Market Trends and Analysis
Gold prices are maintaining strong momentum above the $4,600 level, driven by increased U.S. Treasury buying, a weaker dollar, and rising Chinese demand. While technical indicators point to overbought conditions and hint at a potential short-term pullback, key support levels remain rock solid.
Gold Futures Briefing — August 25, 2026
Current Gold Prices and Key Metrics
- Current Price (August 25): $4,631.57
- December Futures (August 24): Open at $4,673.40, trading at $4,712.60 as of 8:30 AM (ET)
- Weekly Range: Surged over 5% last week, hitting $4,659.92 during the European session on August 24 to mark a nearly 3-month high.

Market Drivers and News Analysis
- U.S. Treasury Bond Purchases: The U.S. Treasury expanded its bond purchases, causing the dollar to weaken and serving as a major tailwind for gold prices.
- Increased Gold Buying in China: A sharp surge in Chinese gold demand is underpinning the metal's strength. Even as Western retail and jewelry demand softens, buying from central banks and Asian markets continues to drive steady momentum.
- Waiting on U.S. Inflation Data: Although gold has reached a 3-month high, upside momentum has cooled near key psychological resistance ahead of upcoming U.S. inflation data releases, leading to a period of consolidation.
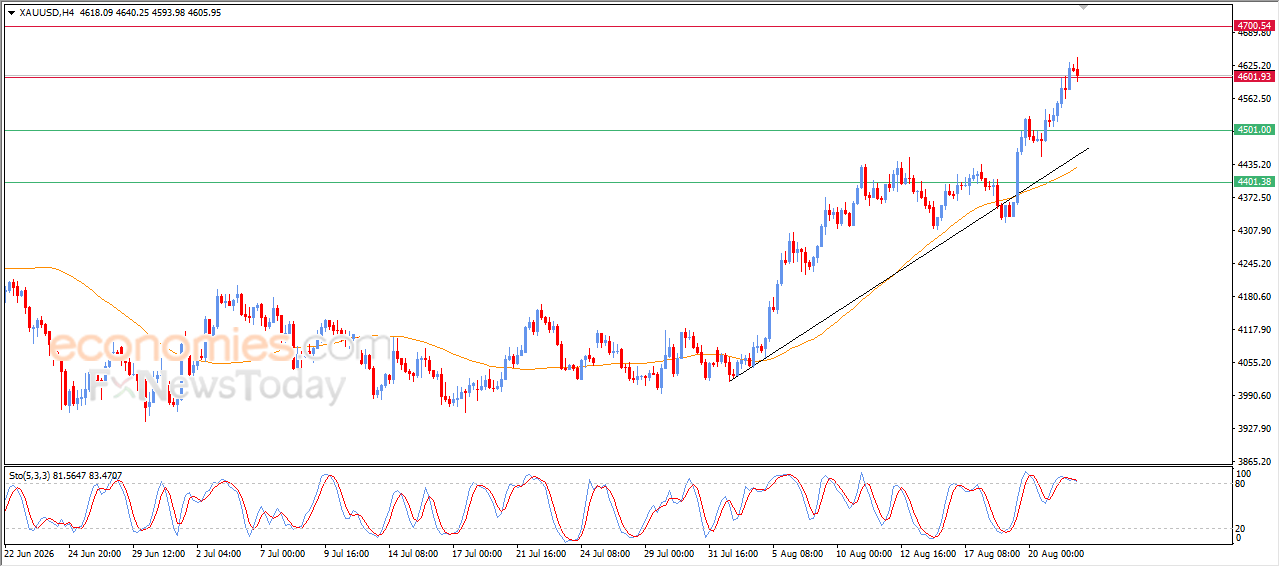
Technical Chart Analysis and Trading Scenarios
- Key Resistance: The $4,700 area is acting as a major hurdle, with prices facing limited upside around this threshold.
- Technical Indicator Status: Key indicators like the Relative Strength Index (RSI) clearly show overbought conditions, leading to some short-term profit-taking and a minor correction.
- Trend Continuation: Gold continues to trade above the 50-day EMA, preserving the overall stability of its bull trend.
Macro Context
- Weaker Dollar Index: Growing concerns over U.S. fiscal credibility tied to expanded Treasury purchases have pushed the dollar lower, boosting the appeal of dollar-denominated gold.
- U.S. Treasury Yields: Despite persistently high U.S. yields, dollar weakness stemming from shifts in Treasury buying policy has failed to offset the upward pressure on gold.
- Central Bank Gold Buying Trends: During the second quarter of 2026, central banks bought a record-breaking 289 tons of gold even during price dips, reinforcing structural demand and providing a strong long-term floor for the gold market.
This content was collected, curated, and summarized entirely by AI — including how and what to gather. It may contain inaccuracies. Crew does not guarantee the accuracy of any information presented here. Always verify facts on your own before acting on them. Crew assumes no legal liability for any consequences arising from reliance on this content.
Powered by
