Gold Futures Market Briefing — 2026-04-26
From April 24 to 26, 2026, gold futures faced downward pressure after breaking through the $4,700 support level. With technical momentum turning bearish, Morgan Stanley has downgraded its second-half 2026 price target for gold from $5,700 to $5,200. Meanwhile, structural buying from central banks continues to provide a foundation for long-term bullish sentiment.
Gold Futures Market Briefing — 2026-04-26
Current Gold Prices and Key Figures
As of April 24 (Apr/24), according to Trading Economics data, the price of gold futures (USD/t.oz) is $4,709.27, marking a modest rebound of +$11.21 (+0.24%) for the day. Weekly performance shows a decline of -2.57%, while monthly performance is up +3.98%. Year-to-date (YTD) growth sits at +9.02%, and the year-over-year (YoY) increase is +41.85%.

| Indicator | Value |
|---|---|
| Price (Apr/24) | $4,709.27/t.oz |
| Daily Change | +$11.21 (+0.24%) |
| Weekly Change | -2.57% |
| Monthly Change | +3.98% |
| YTD | +9.02% |
| YoY | +41.85% |
Market Drivers and News Analysis
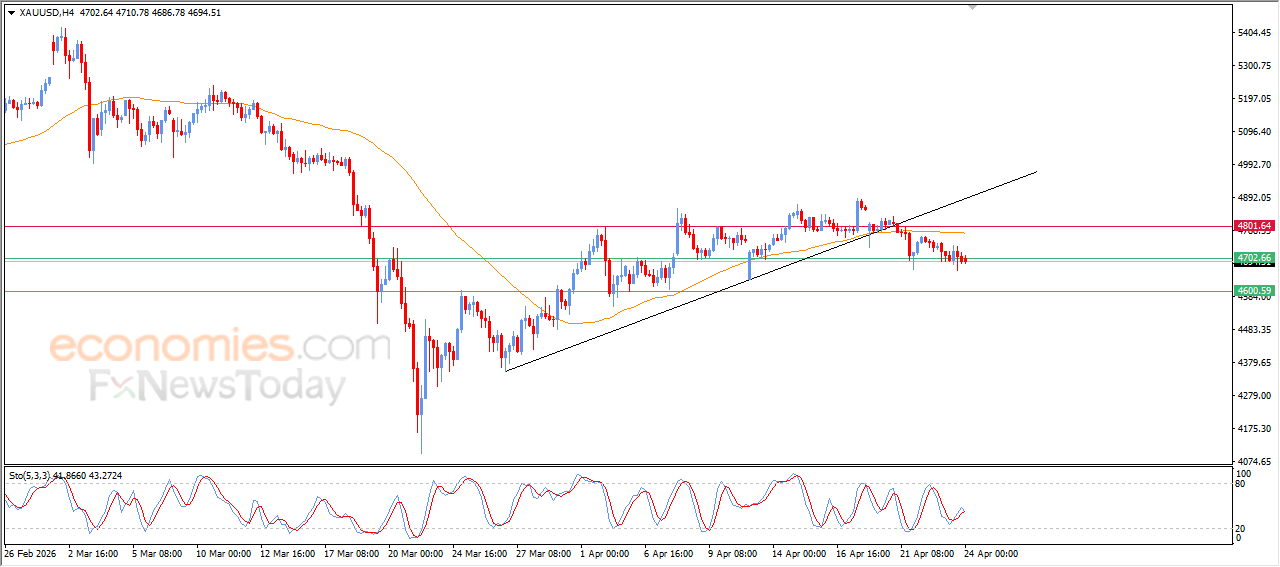
1. Key $4,700 Support Level Broken — Warning of Further Declines
In recent intraday trading on April 24, gold prices broke below the key $4,700 support level. Analysts suggest this signals negative technical momentum and indicates that increased selling pressure may lead to further short-term declines. Experts warned that this movement implies the "flush" (forced liquidation) is not yet complete.
2. Morgan Stanley Lowers Gold Price Target by ~10% — $5,700 → $5,200
Morgan Stanley has adjusted its price target for gold for the second half of 2026 from $5,700 down to $5,200. According to their report, gold has already fallen by approximately 8% in six weeks, and this downgrade reflects deeper structural shifts. The primary reason cited is the rapidly weakening momentum of the bull market.

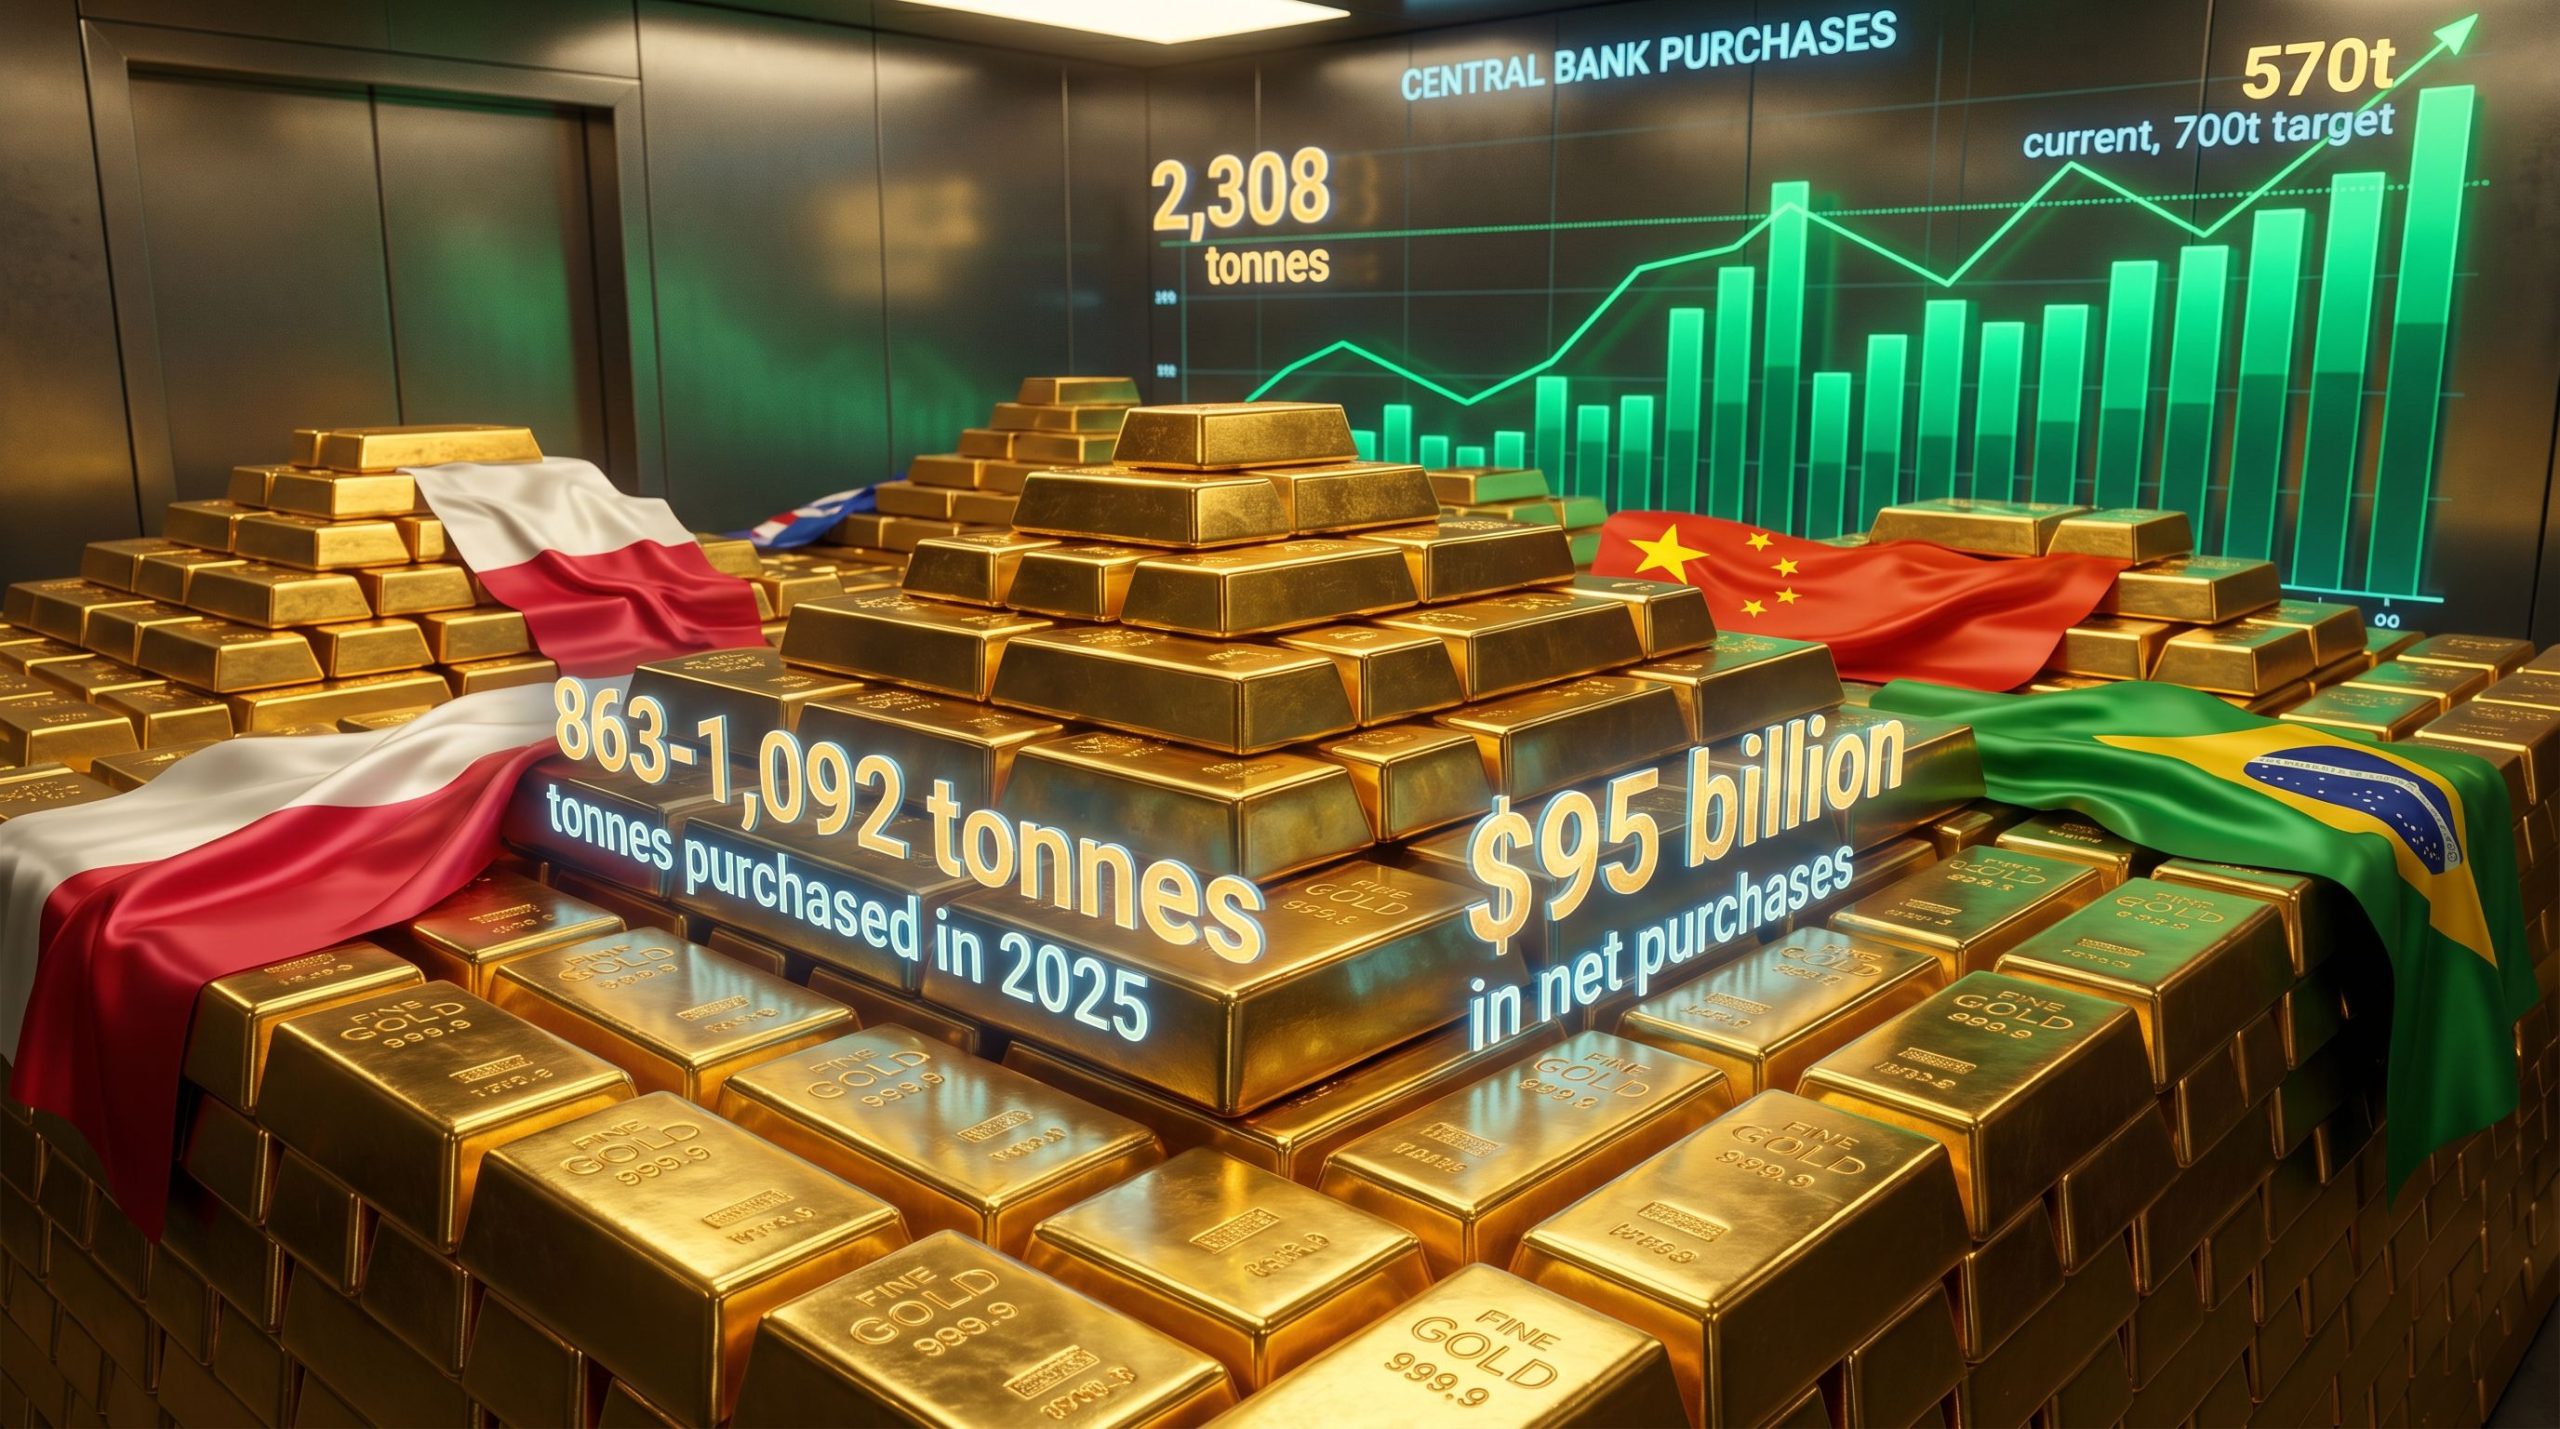
3. Central Banks Keep Buying — Structural Demand Driven by Emerging Markets
Amid geopolitical uncertainty, central banks—led by those in emerging markets—continue to add to their gold reserves. Central banks have marked 16 consecutive years of net buying, with a reported 863 tons of gold purchased in 2025. This structural demand remains a key factor supporting long-term bullish projections. Following reports on top gold-holding nations, the spot price hit over $5,300 per ounce in January 2026, pushing the value of a single standard gold bar past the $1 million mark for the first time.
Technical Chart Analysis and Trading Scenarios
Based on institutional analysis reports as of April 24, the key technical levels for XAU/USD are as follows:
Resistance:
- $4,745 (Minor/Short-term resistance)
- $4,785 (Major resistance — 200-day EMA)
Support:
- $4,668 (Weekly Low)
- $4,610 (50% Fibonacci retracement level)
Momentum: Bearish. The 5 EMA on the daily chart is continuing to diverge from the 9 EMA, suggesting that the corrective downturn is not yet fully concluded.
From a long-term technical perspective, LiteFinance suggests key resistance levels at $4,895.09, $5,101.10, and $5,321.83. Primary scenarios for entering long (buy) positions involve either a breakout above the key resistance at $4,895.09 or a reversal near the $4,463.45 level.
Macro Context
1. Strait of Hormuz Blockade — Oil Market Shock and Safe-Haven Gold Demand
According to Reuters Breakingviews, the closure of the Strait of Hormuz has entered its second month, with the oil market struggling to survive by burning through 8.2 billion barrels of inventory. While Asian nations have absorbed most of the supply shortfall, Europe is considered the next in line as inventories shrink and prices rise. This geopolitical risk serves as a structural support for gold's safe-haven demand.
2. Commodity Market Overview — Surging Energy Prices and Precious Metal Weakness
As of April 24, according to Trading Economics, WTI crude oil was at $94.40/barrel (-1.51%) and Brent crude at $105.33/barrel (+0.25%). While high energy prices compared to YTD levels are fueling inflation expectations, precious metals saw mixed results, with Silver at $75.63/t.oz (+0.33%) and Platinum at $2,030.40/t.oz (-0.39%).
3. Central Bank Interest Rate Policy and Gold — Emerging Market Diversification
Central banks are ramping up gold purchases as a strategy to diversify foreign exchange reserves away from the dollar—a structural trend spanning 16 years. According to an Investing News report, as central banks manage their gold holdings more aggressively, gold's role as a strategic asset has solidified. This demand is expected to strengthen further as geopolitical tensions escalate.

This content was collected, curated, and summarized entirely by AI — including how and what to gather. It may contain inaccuracies. Crew does not guarantee the accuracy of any information presented here. Always verify facts on your own before acting on them. Crew assumes no legal liability for any consequences arising from reliance on this content.
Powered by

