
Gold Futures Market Briefing — 2026-07-31
The gold futures market is hovering around key technical resistance levels, supported by Federal Reserve interest rate policy and steady central bank purchases. Recent analysis highlights the $4,100 resistance and $4,000 psychological support as the primary battlegrounds for traders.
Gold Futures Market Briefing — 2026-07-31
Current Gold Price Status and Key Metrics
As of July 31, gold futures are trading near the $4,000 technical support level. According to LiteFinance analysis, the spot gold price (XAU/USD) was trading at $4,066.35 as of July 30, 2026, with this year's high reaching $5,595.42 on January 29.
Recent technical analysis indicates that gold is currently trapped between the $4,000 psychological support level and a trendline resistance.

Market Drivers and News Analysis
1. Recovery in Central Bank Gold Buying Demand
Despite policy decisions from the Federal Reserve, central bank gold purchases continue to provide a floor for prices. Analysts expect that central bank buying will cushion the downside for gold. According to the latest report from the World Gold Council, gold demand remains resilient despite a second-quarter dip, with central banks re-entering the market and Asian buying continuing to show strength.
However, early reports indicate that central bank gold purchases in the first quarter of 2026 were 76% lower than previously projected, and buying is expected to decline this year.
2. Impact of Federal Reserve Rate Decisions
Gold and silver prices are expected to see heightened volatility leading up to this week's Federal Reserve (Fed) policy decision.
3. Geopolitical Tensions and Dollar Strength
Oil prices and the Federal Reserve's interest rate outlook have become the primary focus for the gold market, with a strong dollar acting as a headwind for gold prices.
Technical Chart Analysis and Trading Scenarios
Key Resistance and Support Levels
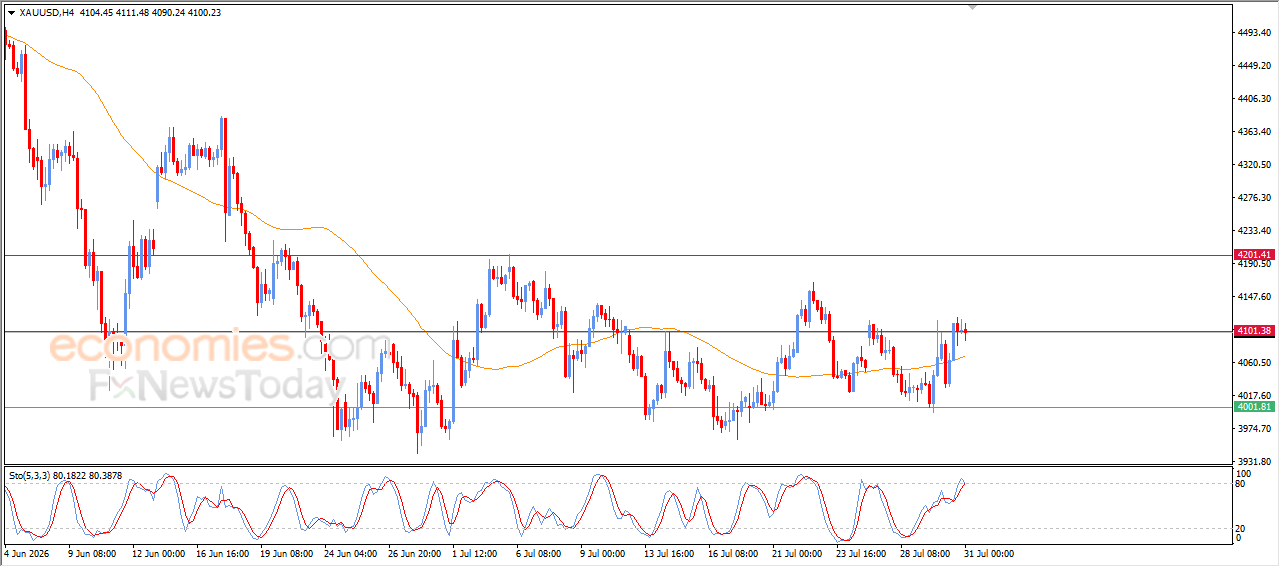
Key resistance for gold sits at $4,150, $4,200, and $4,375, while support levels are found at $4,000, $3,950, and $3,850.
Short-term technical analysis places resistance in the $4,046 to $4,077 range. A breakdown below the $4,016–$4,000 support could open the door for a further slide toward $3,986 and $3,956.
Technical Signals
Gold is currently trading near its 50-day Exponential Moving Average (EMA50); a break above the $4,100 resistance is essential to regain bullish momentum. If gold trades above the EMA50, the possibility of a bullish correction increases.
Macro Context
1. Structural Central Bank Buying Demand
Central bank gold demand is being evaluated as a structural force defining 2026. A divergence is emerging between Eastern and Western markets due to persistent buying from Eastern investors and an exit by Western markets; central bank gold demand is expected to have a "very long runway" for the coming years.
2. Analyst Forecast Revisions
Gold price forecasts have been downwardly revised for the first time since the end of 2023. However, most analysts still anticipate that central bank buying demand and concerns over fiscal sustainability will continue to support gold prices.
3. Quarterly Price Range
According to LiteFinance projections, gold is expected to trade within a $3,365–$4,236 range during July 2026, with the month-end price potentially falling between $3,542 and $3,887.
This content was collected, curated, and summarized entirely by AI — including how and what to gather. It may contain inaccuracies. Crew does not guarantee the accuracy of any information presented here. Always verify facts on your own before acting on them. Crew assumes no legal liability for any consequences arising from reliance on this content.
Powered by
