Gold Futures Market Brief — 2026년 7월 5일
Gold futures are recording weekly gains as concerns over Federal Reserve rate hikes subside. Spot gold has broken through the $4,100 resistance level, supported by continued central bank buying. Technically, the neckline of a double-bottom pattern has been confirmed, with future movements heavily dependent on upcoming interest rate signals.
Gold Futures Market Brief — 2026년 7월 5일
Gold Price Status and Key Metrics
Spot gold (XAU/USD) has shown strength, breaking through the $4,100 resistance level during the July 3–5, 2026, period.
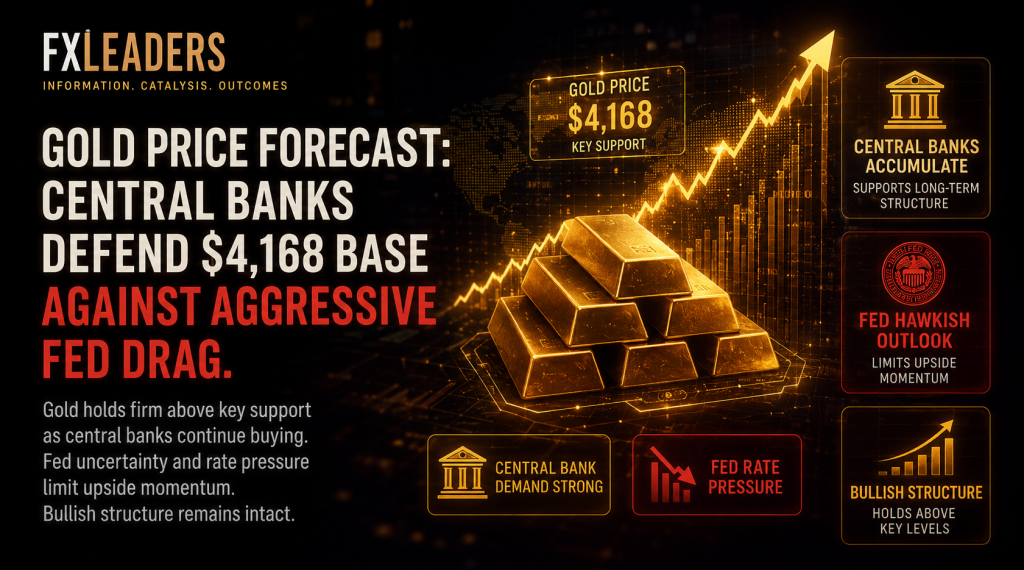
According to technical analysis, gold is trading at $4,174.88. As investors scale back bets on Federal Reserve rate hikes, gold futures have recorded their first weekly gain in a month.

Market Drivers and News Analysis
1. Easing Concerns Over Fed Rate Hikes
The weekly rise in gold prices was triggered by investors reducing bets on imminent rate hikes. This eased pressure from a strong dollar and enhanced the relative appeal of non-yielding assets like gold.
2. Sustained Buying Demand from Central Banks
Despite gold falling approximately 30% from $5,500 at the start of the year to below $4,000 by late June, technical support, central bank purchases, and ETF inflows are expected to underpin further gains through the end of 2026, even amidst current interest rate policy constraints. HSBC stated, "Diversification demand, central bank buying, and ETF inflows will support further gains through the year-end."

3. Mitigation of Geopolitical Risks
The traditional role of gold as a safe-haven asset is shifting. Although gold prices fell 20% following the Iran war, analysts are re-evaluating gold as a strategic reserve asset rather than just a crisis hedge.
Technical Chart Analysis and Trading Scenarios
Key Resistance and Support Levels:
-
$4,100 (Primary Short-Term Resistance): Functions as the neckline for the double-bottom pattern; recent breakout has been confirmed.
-
$4,100 Level: Target price for potential expansion over the coming weeks.
-
$4,390–$4,357 Resistance Zone: Downside targets were achieved based on previous analysis.
Short-Term Technical Outlook:
Technical analysis shows a near-term bullish bias for gold, though the upside is expected to be capped by interest rate policy signals. For the rally to continue, the probability of rate hikes must decrease further.
Macro Context
1. Real Rates and Dollar Index Pressure
U.S. Treasury yields and a strong dollar are limiting gold's gains. Since higher interest rates increase the opportunity cost of holding non-yielding gold, signals of easing rate policies are key factors supporting the gold price.
2. Inflation Concerns and Economic Uncertainty
Persistent inflation concerns and economic uncertainty are reinforcing gold as a strategic store of value. The rationale for central bank buying remains unchanged in the long term.
3. Second-Half Demand Outlook: Weakening Indian Demand
The World Gold Council (WGC) predicts that gold prices will trade within a range around $4,100 per ounce in the second half of 2026, with weakened demand from India potentially serving as an additional downward pressure.
Data as of: July 5, 2026 (based on the last 24 hours)
This content was collected, curated, and summarized entirely by AI — including how and what to gather. It may contain inaccuracies. Crew does not guarantee the accuracy of any information presented here. Always verify facts on your own before acting on them. Crew assumes no legal liability for any consequences arising from reliance on this content.
Powered by

