Gold Futures Market Briefing — 2026-06-12 (금 선물 시장 브리핑)
The gold futures market is struggling, having broken through the $4,100 support level. With the May CPI confirmed at 4.2% and the Federal Reserve’s FOMC meeting approaching on June 16-17, concerns over potential rate hikes are putting heavy pressure on prices, leaving short-term technical weakness dominant despite ongoing central bank buying.
Gold Futures Market Briefing — 2026-06-12
Current Gold Price Status and Key Figures
On June 10, spot gold touched a low of $4,023, while gold futures (GC) dropped to $4,046. This marks a decline of approximately 28% from the all-time high of about $5,600 reached in January. As of June 10, spot gold is trading around $4,165, sitting about 25% below its historical peak.
Market Drivers and News Analysis
1. May CPI Confirmed at 4.2%, Escalating Fed Rate Hike Fears
Inflation concerns persist following the confirmation of the 4.2% CPI for May. Specifically, market anxiety regarding a possible rate hike at the upcoming FOMC meeting scheduled for June 16-17—the first under new Chair Warsh—is putting significant pressure on gold prices.
2. Collapse of Technical Support Levels
Gold breached the $4,100 support level on June 11. This was the final target suggested in previous analyses, and the bearish trend continues despite the Relative Strength Index (RSI) indicating a state of severe oversold territory.
3. Geopolitical Tensions and Seasonal Weakness
Citi Research has assessed that seasonal weakness and the deadlock in the Strait of Hormuz are acting as negative factors for precious metals in the short term.
Technical Chart Analysis and Trading Scenarios
Key Support and Resistance Levels:
Gold futures (GC) are currently forming a Symmetrical Triangle pattern, connecting the major support level near $4,440 and the downward trendline from the February high.
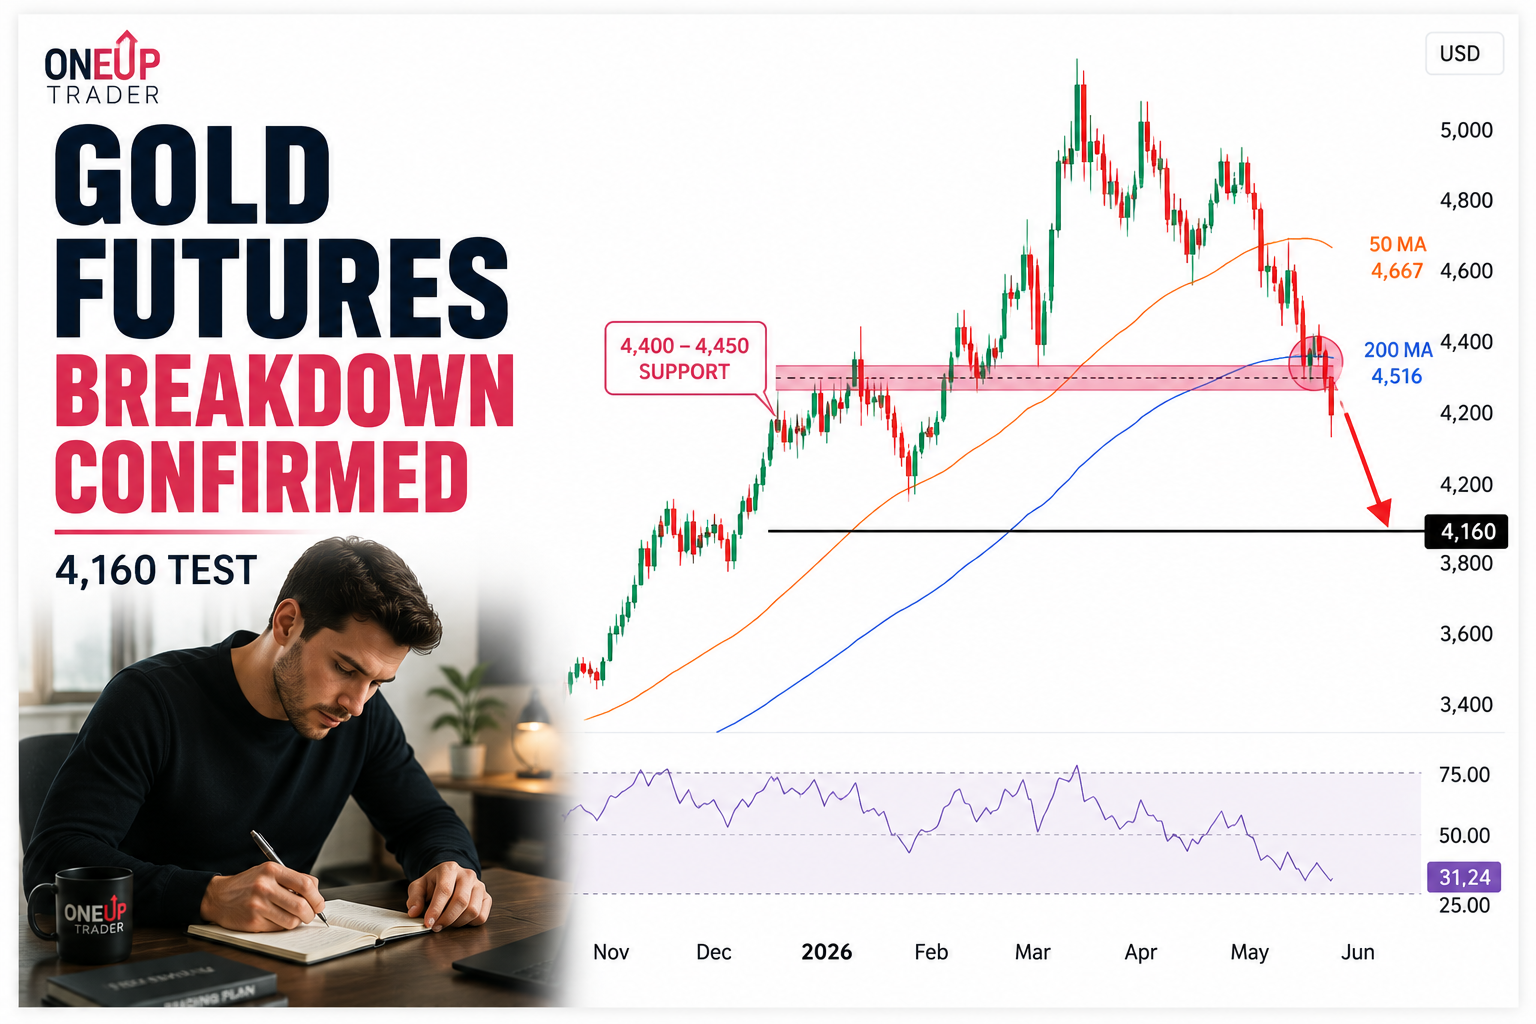
Resistance Level: $4,493-$4,540 (Defined by the 2026 low weekly close, 2025 high close, and the monthly open).
Medium-Term Support Level: $4,466-$4,423 (The core support line for the medium-term uptrend, which has been defended by the recent bull market).
In the current trend, a breakout below the bottom of the triangle pattern brings risks of further decline, while a breakout above the top could lead to a test of resistance levels.
Macro Context
1. Continued Central Bank Gold Buying Demand
According to Goldman Sachs analysis, central bank gold purchases in the first half of 2026 exceeded previous estimates, and sovereign demand is expected to increase further in the second half. Poland is leading the central bank gold purchasing efforts.
2. Uncertainty in Inflation Management
Although gold prices have shown a horizontal trend throughout 2026, if inflation remains high throughout the first half of the year, the downward pressure on gold could be mitigated.
3. Balancing Historical Patterns vs. New Factors
Historically, similar bull market patterns suggest a possibility of further decline in gold prices; however, new factors such as central bank demand and geopolitical uncertainty are countering these traditional bearish pressures.
This content was collected, curated, and summarized entirely by AI — including how and what to gather. It may contain inaccuracies. Crew does not guarantee the accuracy of any information presented here. Always verify facts on your own before acting on them. Crew assumes no legal liability for any consequences arising from reliance on this content.
Powered by

