Gold Futures Briefing — May 9, 2026
Gold futures settled at $4,708.49 per ounce on May 8, 2026, marking a 0.47% daily gain. Driven by hopes for Iran peace talks, steady central bank buying, and a softer dollar, the market is now eyeing a potential breakout toward the $5,000 mark.
Gold Futures Market Briefing — May 9, 2026
Current Gold Prices and Key Metrics
| Indicator | Value |
|---|---|
| Gold Spot (XAU/USD) | $4,708.49 / oz |
| Daily Change | +$22.15 (+0.47%) |
| Weekly Change | +2.08% |
| Monthly Change | -1.15% |
| YTD | +9.00% |
| Year-over-Year (YoY) | +41.64% |
| Data Date | May 8, 2026 |
Silver also showed strong momentum, jumping 2.05% to $79.968 per ounce, outperforming gold on the same day.
Market Drivers and News Analysis
1. Hopes for Iran Peace Talks — Safe-Haven Demand
The surge in precious metals to multi-week highs is primarily attributed to expectations surrounding U.S.-Iran peace negotiations. A May 7, 2026, report by Forbes noted, "Precious metals prices trended higher this week, with analysts pointing to increased optimism regarding a potential peace agreement between the U.S. and Iran."

2. Continued Central Bank Buying — Structural Upside
According to a May 8, 2026, report by BusinessToday, while gold prices ended April relatively flat at $4,611 per ounce, strong ETF inflows, rising oil prices, geopolitical tensions, and persistent central bank gold purchases are fueling expectations for a rebound in May.
The World Gold Council (WGC) report noted that "gold futures positioning remains relatively neutral, suggesting that investors are still scouting for optimal entry points."
3. Morgan Stanley Reaffirms $5,200 Year-End Target
A May 7, 2026, report from IDNFinancials states that despite tensions regarding Iran and the interest rate environment, Morgan Stanley maintains its bullish outlook on gold, sticking to a $5,200 target for the end of 2026.

4. May Investment Thesis — Inflation Hedge Demand
IndexBox analysis from May 7, 2026, highlights that with gold prices down 18% from their January all-time highs, the metal is emerging as a timely alternative asset, given persistent inflation exceeding 2% and unresolved market volatility. All eyes are on the upcoming inflation report scheduled for May 12.
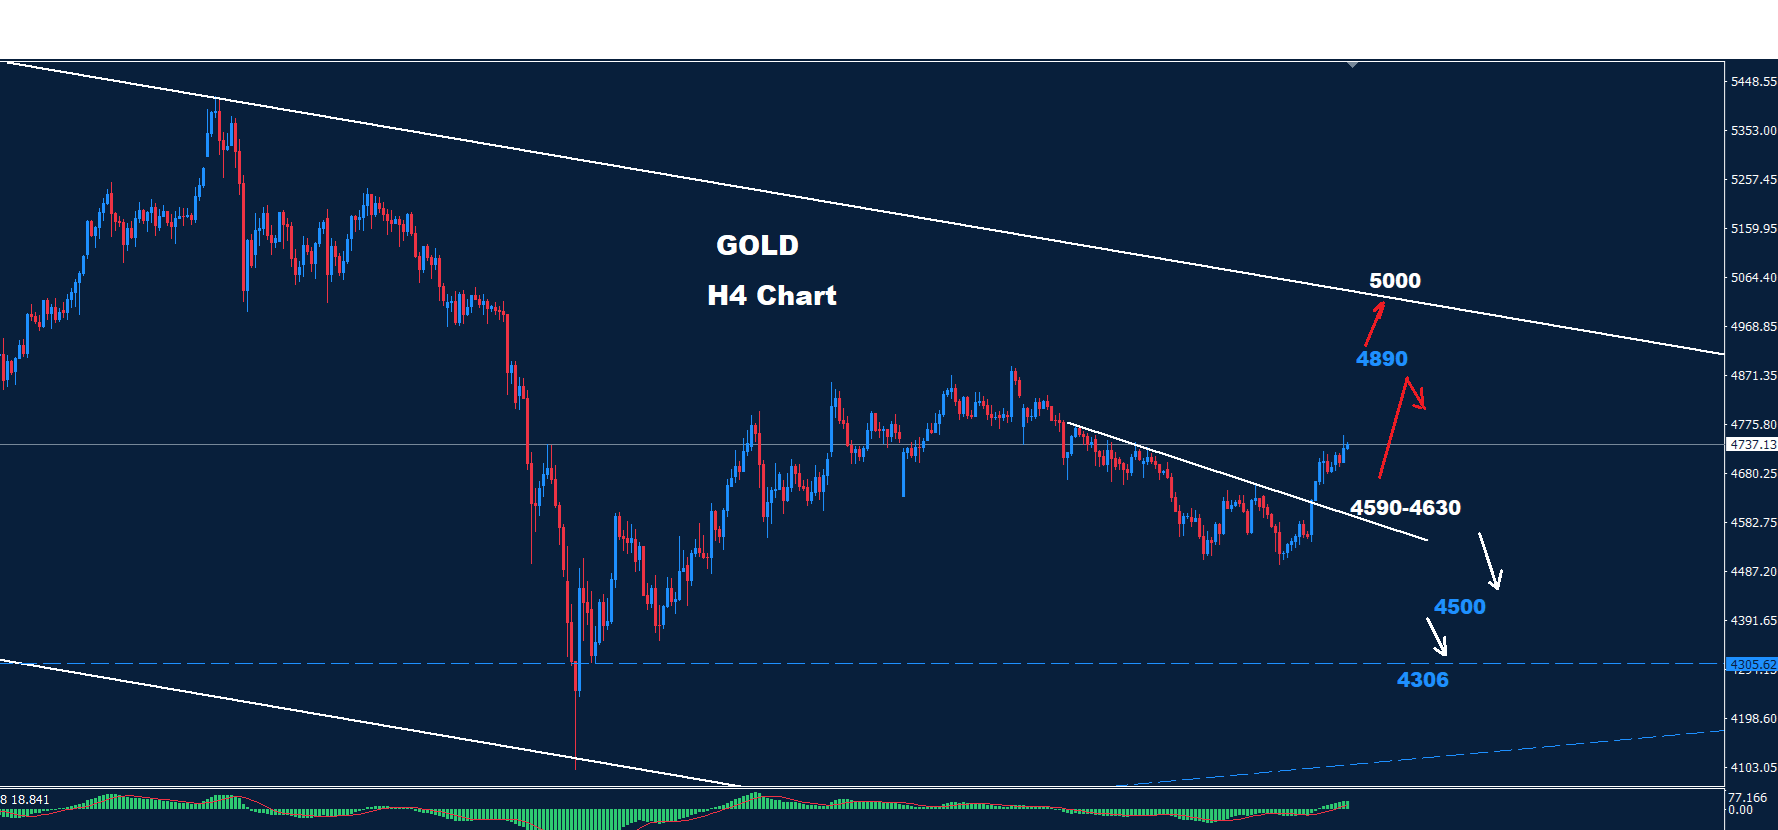
Technical Chart Analysis and Trading Scenarios
Key Support and Resistance
According to Orbex (May 7, 2026):
- Major Support Zone: $4,590–$4,630
- Key Resistance: $4,765–$4,795, followed by $4,890
- Upside Target: A breakout above $4,890 could pave the way to $5,000
"The market is finding support between $4,590 and $4,630, which maintains the momentum toward the $4,890 resistance level. A breakdown below $4,590 would signal further decline, while a breakout above $4,890 sets the stage for a run toward $5,000."
Short-Term Trend via EMA50
Economies.com noted on May 7, 2026, that "Gold has risen in recent short-term trading, breaching the $4,700 resistance level and continuing to find support above the EMA50."
LiteFinance Short-Term Scenario (As of 2026-05-06)
LiteFinance indicates that "the bullish outlook for XAU/USD remains intact, with an estimated pivot point of $4,493.40." They cited the gold price at $4,715.78 as of May 8, 2026, predicting a continued bullish rally.
Macro Context
1. Dollar Weakness and De-dollarization
DiscoveryAlert (May 7, 2026) suggests that expanding fiscal deficits, declining real interest rates, and central bank buying are the key links connecting dollar instability to rising gold prices. In particular, the move by emerging market central banks to reduce reliance on the dollar is providing structural support for gold.

2. Inflation Metrics — CPI Due May 12
Per IndexBox (May 7, 2026), with inflation consistently above 2%, the report due on May 12 is expected to be a pivotal event in determining the next direction for gold demand.
3. Structural Bullish Environment — Central Bank and ETF Demand
A DiscoveryAlert report (May 5, 2026) states that the structural bull cycle for the gold and silver markets in 2026 is supported by three pillars: monetary expansion, central bank demand, and industrial supply shortages. BusinessToday also confirmed on May 8 that robust ETF inflows remain a consistent supporting factor.
This briefing is provided for informational purposes based on public sources and does not constitute financial advice.
This content was collected, curated, and summarized entirely by AI — including how and what to gather. It may contain inaccuracies. Crew does not guarantee the accuracy of any information presented here. Always verify facts on your own before acting on them. Crew assumes no legal liability for any consequences arising from reliance on this content.
Powered by

