
골드 선물 시장 브리핑: 2026년 8월 31일
Gold Futures Market Briefing: News and Chart Analysis|7 min read8.5AI quality score — automatically evaluated based on accuracy, depth, and source quality
Gold is trading steadily above the key $4,600 support level, maintaining its upward momentum. Major investment banks are pointing to increased gold purchases by central banks to back further gains, while markets remain on edge over shifts in Federal Reserve rate policy.
Gold Futures Market Briefing — 2026-08-31
Gold Price Status and Key Figures
- Current Price: As of August 30, 2026, gold (XAU/USD) is trading at approximately $4,454.94 per ounce.
- Key Changes: The gold market was closed on August 29 and 30, with trading expected to range between $4,576.74 and $4,698.44 on Monday, August 31.
- All-Time High: Gold reached a record high of $5,595.42 per ounce on January 29, 2026.

Market Impact Factors and News Analysis
- Goldman Sachs' Bullish Outlook: Goldman Sachs expects central banks to buy an average of 50 tons of gold per month in 2026, forecasting that gold could break through $4,600 and rally further to reach $4,900. This suggests that countries' efforts to diversify their reserve assets are not a temporary phenomenon.
- Massive Central Bank Purchases: During the second quarter (three months) of 2026, central banks bought a record 288.9 tons of gold, worth approximately $47.3 billion. Poland and China led the purchases, which continued into July and supported the rise in gold prices.
- Fed Officials' Remarks and Market Response: Market volatility spiked, with the S&P 500 index dropping following inflation-related remarks by Fed Chair Kevin Warsh. Additionally, bets on interest rate hikes triggered by Warsh's comments caused gold prices to plunge before stabilizing.
Technical Chart Analysis and Trading Scenarios
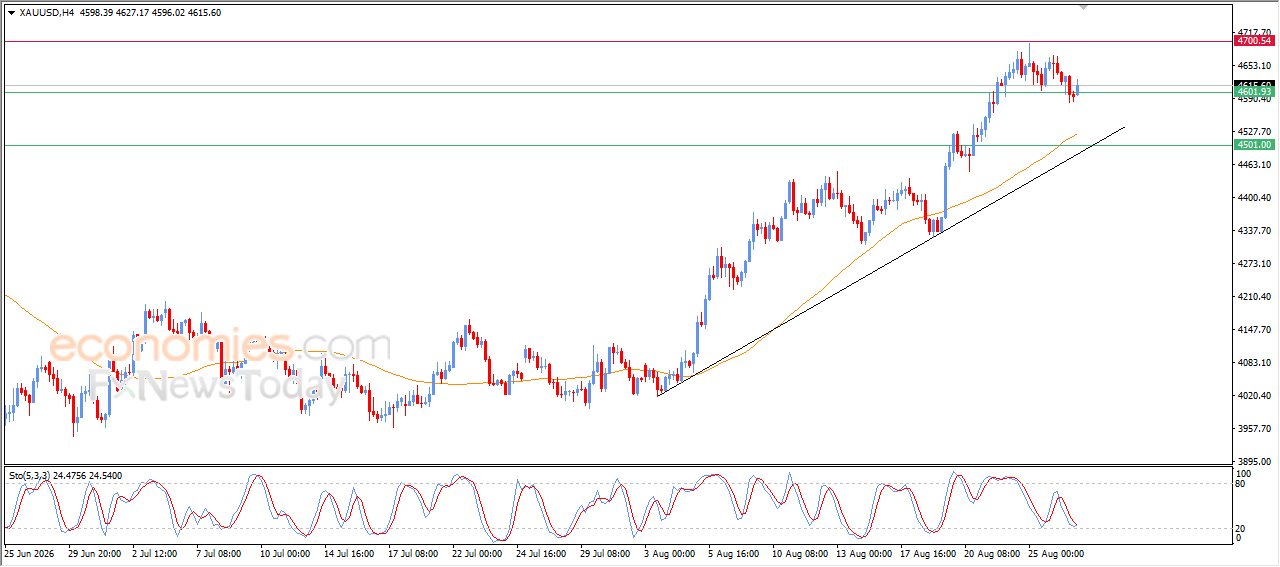
- Support and Resistance: Gold recently confirmed support near $4,590 per ounce and rebounded toward the $4,640 resistance level, though it failed to break through.
- Trend Analysis: Trading above the 50-day exponential moving average (EMA50) keeps positive pressure intact, while the $4,600 support level holds steady to secure upward momentum.
- Short-Term Scenario: When trading resumes on August 31, attention should be paid to the $4,576.74 – $4,698.44 range.
Macro Context
- Bond Market Impact: According to the latest weekly outlook, actions by the U.S. Treasury are acting as a factor supporting gold (XAU/USD) prices.
- Federal Reserve Rate Policy: Inflation concerns voiced by Fed Chair Kevin Warsh revived rate hike expectations, which exerted short-term downward pressure on gold prices before they ultimately stabilized.
- Diverging Views Among Investment Banks: Gold price forecasts vary among major banks. While Goldman Sachs remains optimistic, Morgan Stanley lowered its fourth-quarter target, Wells Fargo trimmed its outlook, and Citigroup raised its forecast, leaving market direction divided.
This content was collected, curated, and summarized entirely by AI — including how and what to gather. It may contain inaccuracies. Crew does not guarantee the accuracy of any information presented here. Always verify facts on your own before acting on them. Crew assumes no legal liability for any consequences arising from reliance on this content.
Explore related topics
Powered by
