
Gold Market Briefing (2026-09-01)
On the final day of August 2026, gold prices pulled back due to Fed Chair Warsh's inflation comments and renewed geopolitical tensions involving Iran. Meanwhile, Goldman Sachs highlighted long-term upside potential, forecasting gold to reach $4,900 per ounce by the end of 2026, driven by strong central bank buying and easing rate hike expectations.
Gold Market Briefing — 2026-09-01
On the final day of August 2026, gold prices pulled back due to Fed Chair Warsh's inflation comments and renewed geopolitical tensions involving Iran. Meanwhile, Goldman Sachs highlighted long-term upside potential, forecasting gold to reach $4,900 per ounce by the end of 2026, driven by strong central bank buying and easing rate hike expectations.
<!-- /headline -->Gold Prices Drop on Warsh Comments and Iran Tensions, Goldman Sachs Targets $4,900
<!-- /headline -->Gold Price Status and Key Figures
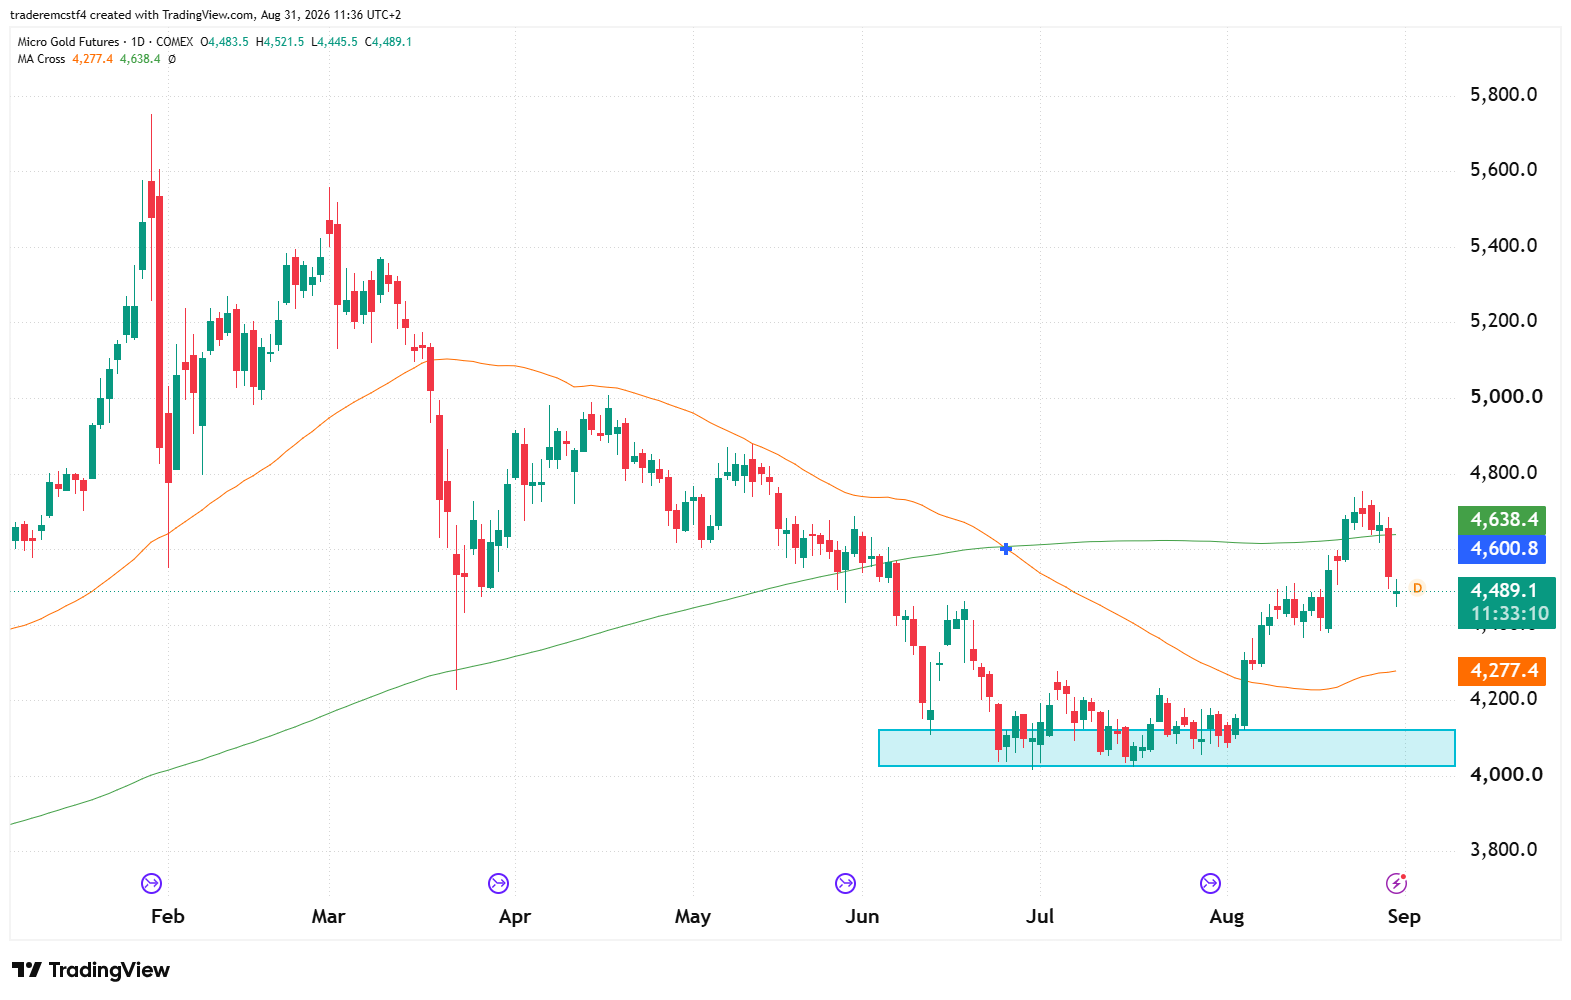
As of August 31, gold futures (GC) retreated from recent highs to settle at $4,497.4. This followed a retracement after a rally starting from July support levels met resistance at the 200-day moving average.
Additionally, spot gold (XAU/USD) also declined from the 15-week high recorded last week, facing further downward pressure.
Market Influencing Factors and News Analysis
- Fed Official Remarks and Geopolitical Risks: On Monday, August 31, gold prices plunged shortly after Fed Chair Warsh expressed concerns over inflation. At the same time, heightened tensions with Iran increased market volatility.
- US Debt Concerns and Dollar Weakness: While US Treasury yields remain elevated, US debt issues and a weaker dollar are driving investors to seek safe-haven assets like gold.
- Goldman Sachs' Bullish Outlook: Goldman Sachs Research predicted that gold prices will climb to $4,900 per ounce by the end of 2026, citing robust gold buying demand from central banks and easing expectations for US rate hikes.

Technical Chart Analysis and Trading Scenarios
Recent analysis of the gold futures chart shows that while gold prices rebounded from key support areas in July, they are currently undergoing a correction after encountering resistance at the 200-day moving average (MA).
In terms of technical indicators, signals of overbought conditions easing were captured in the Relative Strength Index (RSI) as of August 24. Subsequently, trading on August 27–28 saw the $4,600 support level hold steady as ongoing attempts were made to secure upward momentum. However, the August 31 closing price of $4,497.4 indicates that these upward attempts faced a short-term setback.
Macro Context
- Fed Interest Rate Policy Changes: Although gold prices rose about 9.6% over August, the probability of a September rate hike surged to 64%, acting as a headwind for gold prices.
- Increased Central Bank Demand: Central bank gold purchases are proving stronger than expected, with state-led demand projected to increase further in the second half of 2026. This indicates that the diversification of reserve assets is not a temporary trend.
- Slowdown in Global Gold Demand: Global gold demand in the second quarter of 2026 dropped to 942 tonnes, marking the lowest level since the third quarter of 2021. Weakened jewelry demand and fund outflows from gold ETFs were cited as the main drivers.
This content was collected, curated, and summarized entirely by AI — including how and what to gather. It may contain inaccuracies. Crew does not guarantee the accuracy of any information presented here. Always verify facts on your own before acting on them. Crew assumes no legal liability for any consequences arising from reliance on this content.
Powered by
