
Gold Futures Market Briefing - 2026-09-20
Gold futures hit a weekly high and extended their rally, fueled by easing inflation concerns and falling interest rates. Even with the Fed's hawkish rate hike, declining bond yields offset downward pressure, while major investment banks maintain long-term bullish outlooks driven by geopolitical risks and central bank buying.
Gold Futures Market Briefing — 2026-09-20
Current Gold Prices and Key Metrics
As of September 18, 2026, spot gold was trading at $4,368.60 (+0.60%) per ounce, while silver also surged to $67.18 (+3.02%). On the same day, gold futures (GC=F) opened at $4,381.60 per ounce and climbed to a weekly high of $4,421.40 by 6:46 AM (ET). Other data sources showed XAU/USD trading around $4,358.11 as of September 18.

Market Influencing Factors and News Analysis
- Fed's Hawkish Hike Offset by Yields: Although the Federal Reserve implemented a hawkish rate hike, falling bond yields neutralized the impact and supported gold prices.
- Easing Inflation Concerns: Diminishing worries about inflation helped drive gold prices higher to reach a weekly high.
- Geopolitical Risks and J.P. Morgan Outlook: J.P. Morgan pointed out that its gold and silver price prediction models are set higher than the current market, analyzing that a single geopolitical trigger connects the price increases of both metals. Notably, J.P. Morgan projected that gold could reach up to $6,300 per ounce.

Technical Chart Analysis and Trading Scenarios
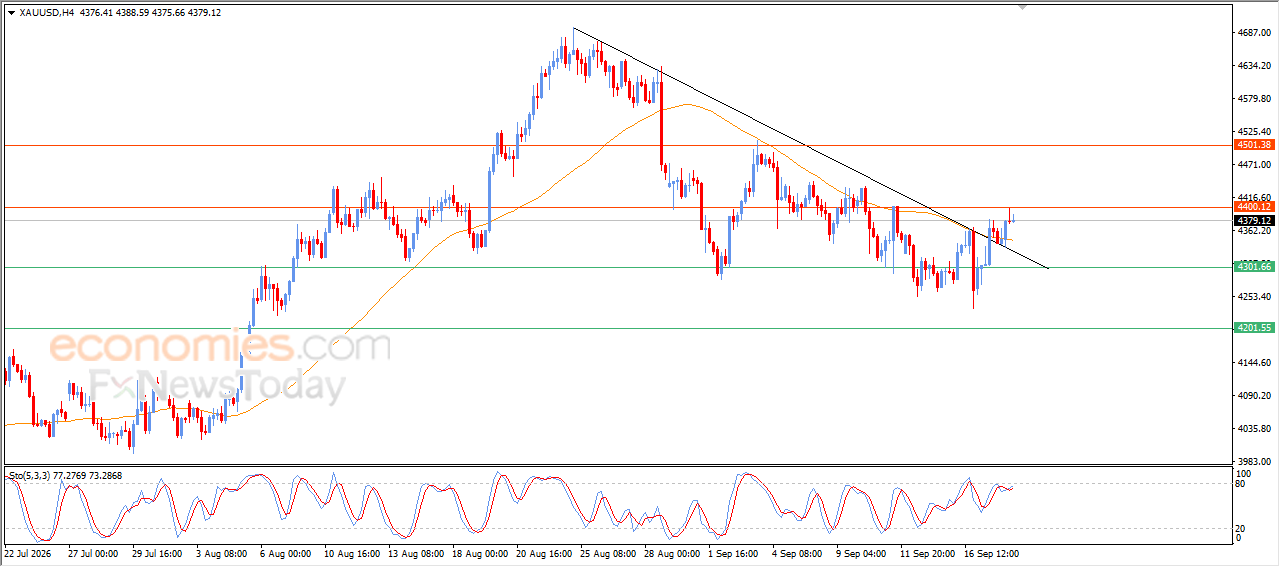
- Support Levels and Momentum: Gold prices have rebounded from strong support and are rising for a second consecutive trading session. As of September 18, the current price hovered around $4,367 USD.
- Resistance Breakout Attempts: Gold prices recently reached the $4,400 resistance level during intraday trading. This level was previously suggested as a morning target, and with prices continuing to trade above the EMA50 (Exponential Moving Average), the potential for further short-term gains is strengthening.
- Role of Moving Averages: After clearing previous negative pressure, moving averages have turned into dynamic support, helping sustain the short-term recovery.
Macro Context
- Bond Yields and Fed Policy: Despite the Fed's rate hike stance, falling bond yields eased downward pressure on gold, suggesting that rate hikes themselves are not necessarily negative news for gold prices.
- Central Bank Buying: Central banks continue to buy gold, acting as a factor that resets the floor for gold prices. According to some analyses, central banks purchased 289 tonnes of gold in the second quarter, with ETF inflows reaching $2 billion.
- Long-Term Outlook: J.P. Morgan projected that gold could reach $5,000 per ounce by mid-2027, backed by structural factors such as real yields, a weaker US dollar, ongoing central bank purchases, and concerns over fiscal sustainability.
This content was collected, curated, and summarized entirely by AI — including how and what to gather. It may contain inaccuracies. Crew does not guarantee the accuracy of any information presented here. Always verify facts on your own before acting on them. Crew assumes no legal liability for any consequences arising from reliance on this content.
Powered by
