
Gold Futures Market Update — 2026-07-19 시장 브리핑
The gold futures market remains under pressure as expectations for Federal Reserve rate hikes and a strong dollar weigh on prices. Technically, the price is trading between resistance at $4,050 and support at $3,940, with central bank buying providing a structural floor.
Gold Futures Market Update — 2026-07-19
Current Gold Price and Key Metrics
As of July 17, 2026, spot gold was trading at $4,015.75/oz.
Gold has seen a significant decline, dropping 28% from its peak in January.

Market Influencers and News Analysis
1. Federal Reserve Rate Hike Expectations
The market expects the likelihood of Federal Reserve rate hikes to increase, which is driving up real yields and negatively impacting gold.
While weak U.S. economic data provided temporary support, gold continues to trend lower, trading near $3,990.

2. Lack of Catalysts Due to Easing Inflation
As inflation cools, demand for gold as an inflation hedge has weakened. OCBC Bank anticipates that gold prices will continue to fall through the end of 2026 due to high U.S. Treasury yields, a strong U.S. dollar, and weak investment demand.
3. Central Bank Buying Provides a Floor
Goldman Sachs noted that consistent demand from central banks is creating a floor for gold prices, with a year-end 2026 target of $4,900/oz.
Technical Chart Analysis and Trading Scenarios
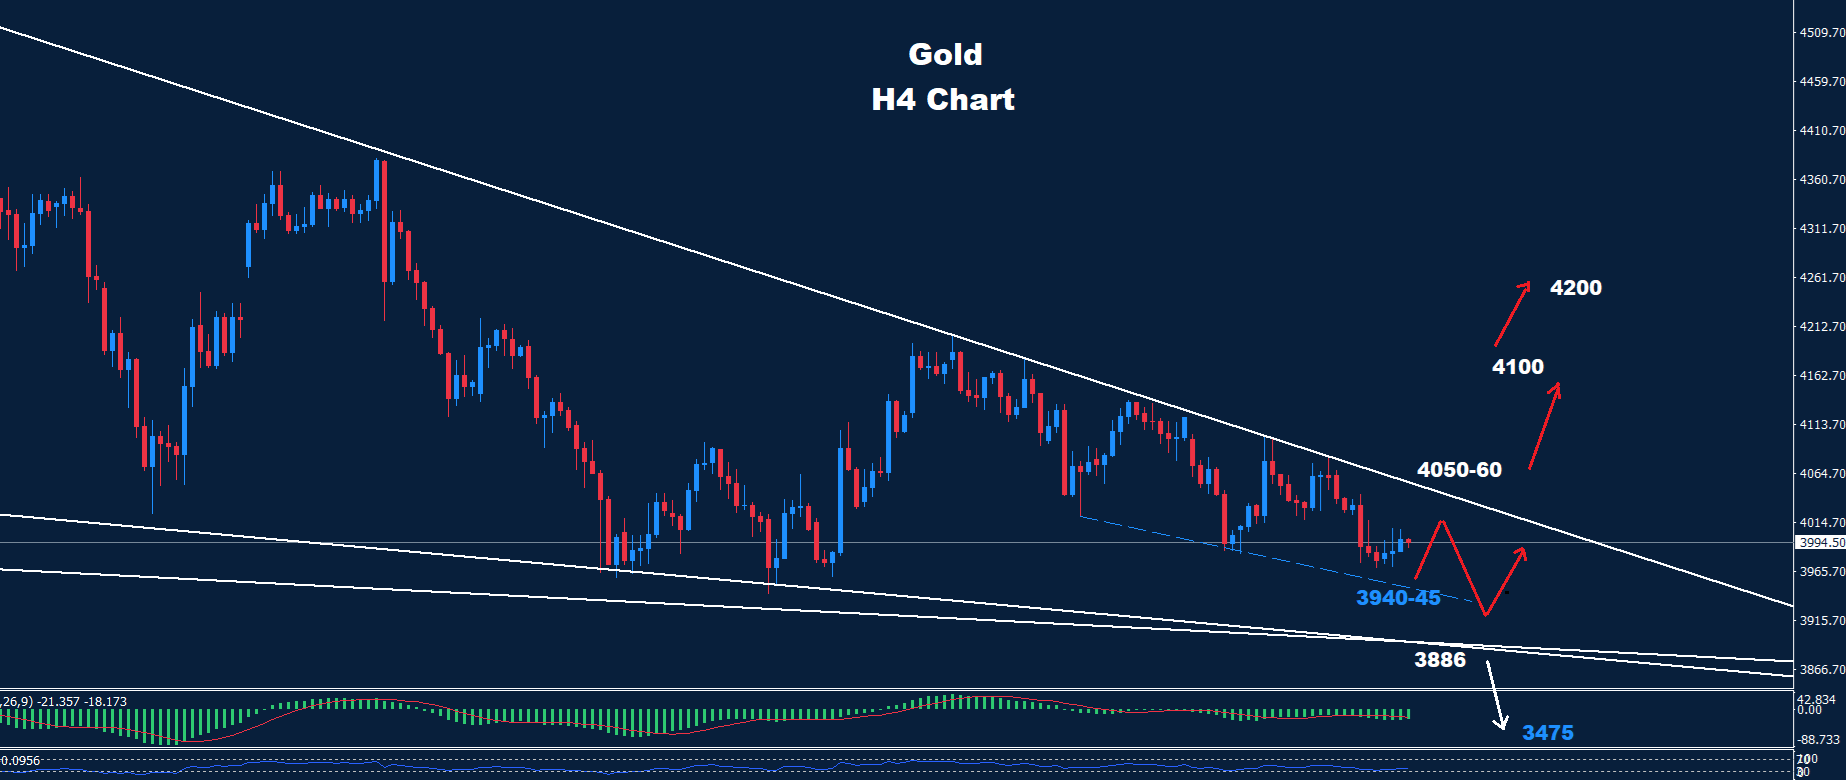
Gold is currently trading within a descending channel, with short-term technical analysis suggesting the following scenarios:
Bullish Scenario:
- Upside Target: $4,050 resistance level
- A potential bounce could see prices reach this level.
Bearish Scenario:
- Short-term Support: $3,940–$3,945
- A drop below this level could lead to further declines toward the mid-term support of $3,886.
Resistance Cluster: Resistance on the daily chart is clustered around the $4,017 and $4,050–$4,060 levels.
Macro Context
1. U.S. Dollar Strength
A strong U.S. dollar is suppressing dollar-denominated gold prices, increasing the cost of gold imports and reducing international demand.
2. Rising U.S. Treasury Yields
Higher U.S. Treasury yields have increased real interest rates, lowering the relative attractiveness of non-interest-bearing assets like gold. This raises the opportunity cost of holding gold.
3. Structural Support from Central Bank Demand
According to the World Gold Council, central bank gold buying reached 244 tonnes in the first quarter of 2026, setting a historical record. This sustained demand provides a floor for gold prices as central banks continue to diversify their reserves away from U.S. Treasuries and into gold.
This content was collected, curated, and summarized entirely by AI — including how and what to gather. It may contain inaccuracies. Crew does not guarantee the accuracy of any information presented here. Always verify facts on your own before acting on them. Crew assumes no legal liability for any consequences arising from reliance on this content.
Powered by
