
Gold Futures Market Briefing — 2026-05-30
The gold futures market is under intense bearish pressure, driven by a strong U.S. dollar and high interest rates. UBS has cut its year-end price forecast from $5,900 to $5,500, as technical analysis shows the metal struggling below key moving averages.
Gold Futures Market Briefing — 2026-05-30
Current Gold Prices and Key Metrics
Gold futures have been trending downward over the past few days. Market analysis shows spot gold dipped to $4,393.12, marking a 1.66% liquidation event, and is currently trading around the $4,433 level.
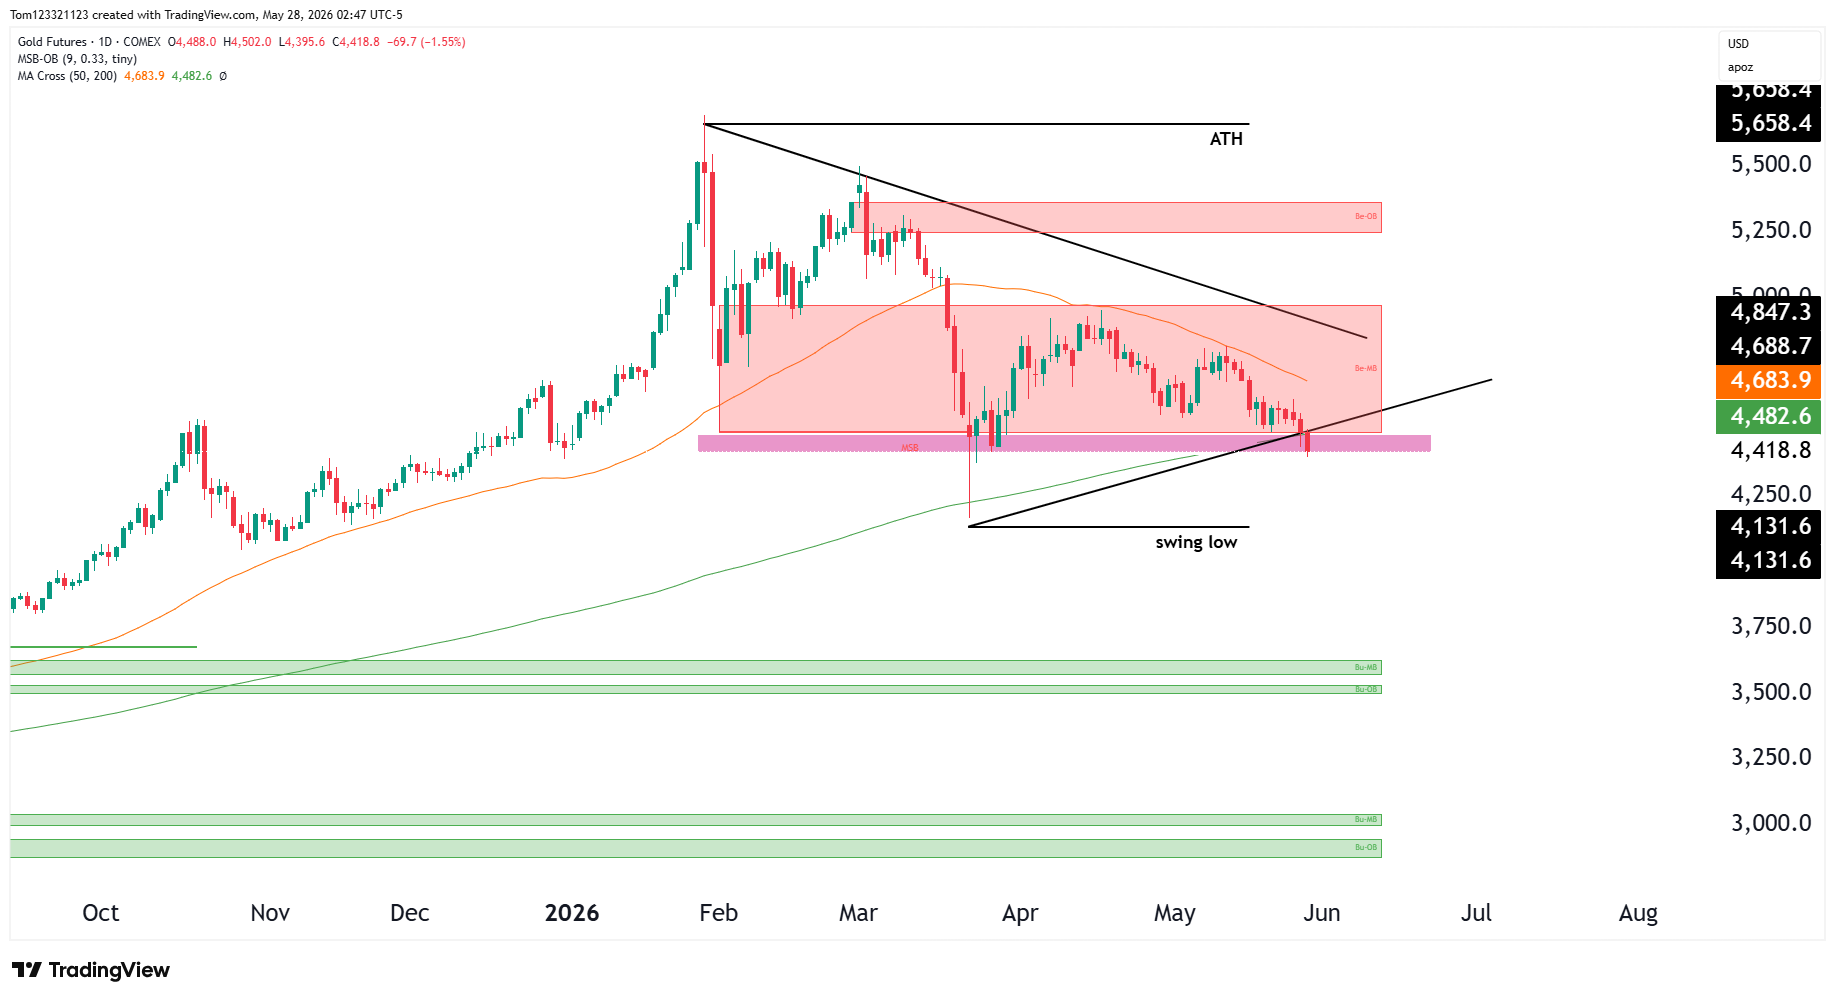
Gold is currently testing its 200-day moving average (200 EMA) for the second time in 2026, signaling significant bearish pressure.
Market Drivers and News Analysis
1. UBS Cuts Gold Price Forecast The Swiss bank UBS has lowered its year-end 2026 price target for gold from $5,900/oz to $5,500/oz. Analysts Dominic Schnider and Wayne Gordon cited headwinds from persistent high interest rates and a strengthening U.S. dollar, noting that "the market is rediscovering the concept of opportunity cost."

2. U.S. Inflation Data and Market Reaction While gold prices trimmed losses following the release of the U.S. April inflation data, the metal still recorded its third consecutive day of decline. Gold has failed to act as an effective inflation hedge, leading to continued weakness.
3. Geopolitical Risks and Structural Demand Although the Iran war could serve as an inflation-driving factor, the Federal Reserve's hawkish stance is capping gold's upside momentum.
Technical Chart Analysis and Trading Scenarios
Gold is currently trading below its downward trendline and the 50-day moving average. Sellers have seized short-term momentum, with major resistance levels aligned with the downward trendline and the 50-day moving average.
Technically, gold is trading within a wide consolidation range, oscillating between $4,300 support and $5,400 resistance. Some analysts believe the 200-day moving average is acting as a decisive resistance point.
Macro Context
1. High Interest Rates Strengthen Opportunity Costs As U.S. Treasury yields continue to rise, the opportunity cost of holding gold is increasing. Since gold does not generate interest, its relative value tends to decrease as interest rates climb.
2. U.S. Dollar Strength The sustained strength of the dollar is suppressing demand for gold. A stronger dollar makes gold more expensive in international markets, which naturally dampens demand.
3. Reuters Market Analysis: Approaching a Critical Pivot Reuters noted that gold is approaching a potential turning point that will determine its price direction. This is considered a critical moment that will decide whether the metal will extend its losses for the year or form the resistance necessary to spark a recovery.

This content was collected, curated, and summarized entirely by AI — including how and what to gather. It may contain inaccuracies. Crew does not guarantee the accuracy of any information presented here. Always verify facts on your own before acting on them. Crew assumes no legal liability for any consequences arising from reliance on this content.
Powered by
