
Gold Futures Market Briefing — 2026-06-04
Gold futures are feeling the heat from rate hike expectations and a stronger dollar, even as central banks keep buying. As of June 2, gold was trading at $4,500.99 per ounce, currently moving between an upward trendline and a downward resistance line.
Gold Futures Market Briefing — 2026-06-04
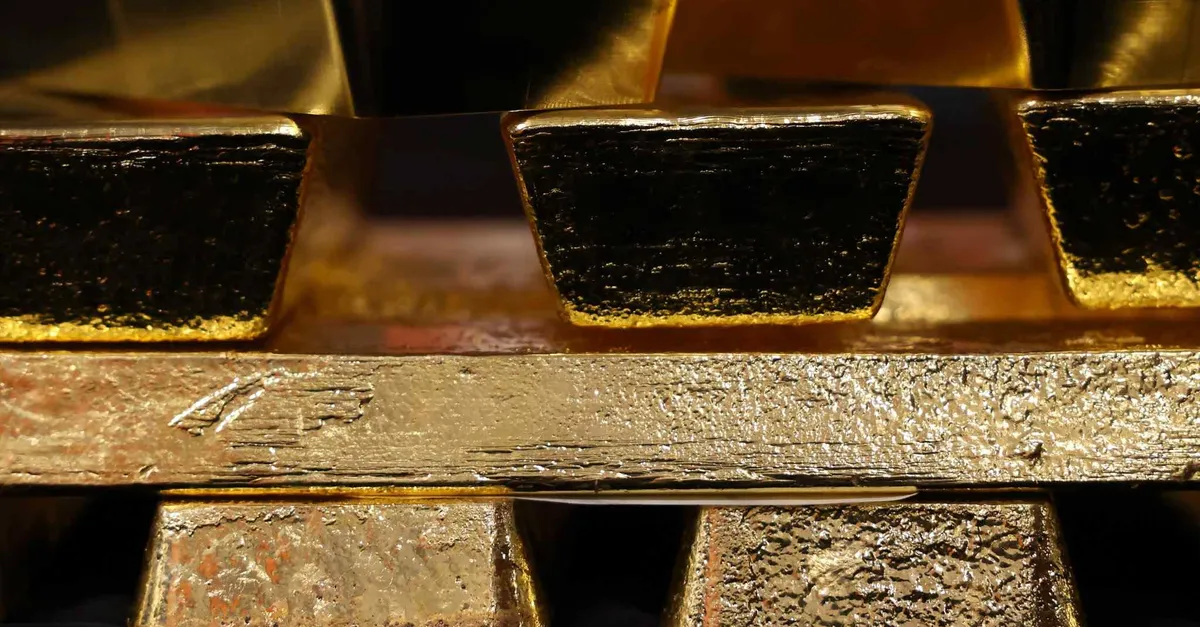
Current Gold Prices and Key Metrics
As of June 2, 2026, gold futures were priced at $4,500.99 per ounce.
Technical analysis shows that gold is currently trading between upward support and downward resistance, showing movement after a rebound near the 4,566 support level.
From a medium-term perspective, gold tested its key support level for the medium-term uptrend at 4,466–4,423, but bulls successfully defended it.
Market Influencers and News Analysis
1. The Dual Nature of Central Bank Demand
According to Goldman Sachs, central bank gold buying is stronger than anticipated, and sovereign demand is expected to keep climbing through the second half of 2026. The European Central Bank (ECB) has reported that central bank gold buying and price appreciation are outpacing U.S. Treasury debt in global foreign exchange reserves. However, this strong demand hasn't been enough to fully offset the pressure from rate hike expectations and a robust dollar.

2. The Burden of Rate Expectations and a Strong Dollar
The traditional correlation between gold and U.S. Treasury yields is breaking down in 2026. Rising tensions between the U.S. and Iran have pushed up the dollar and oil prices, fueling inflation fears and strengthening rate hike expectations—all of which are weighing on gold prices.
3. Geopolitical Risks and Economic Data
Market participants are watching developments in the Middle East and upcoming U.S. economic data to gauge the direction of monetary policy. This uncertainty is increasing volatility in gold prices.
Technical Chart Analysis and Trading Scenarios
Gold is currently forming a triangle convergence pattern between an upward trendline and a downward resistance line. On the daily chart, gold has rebounded from support near 4,566.
From a medium-term technical standpoint, the key support zone remains at the 4,423–4,466 level, an area being actively defended by the bulls.
For short-term trading scenarios, positive Relative Strength Index (RSI) signals are supporting gold as it continues to push against recent resistance levels.
Macro Context
1. Collapse of the Traditional Gold-Bond Correlation
The mechanical correlation between gold and U.S. Treasury yields, which held for decades, is shifting in 2026. The pattern where gold drops when yields rise and climbs when yields fall is no longer set in stone, suggesting a structural change in the gold market.
2. Geopolitical Risk and Inflation Concerns
Rising oil prices caused by Middle East tensions are lifting inflation expectations, leading to a outlook for prolonged interest rate hikes. This "higher-for-longer" rate scenario is driving weakness in gold.
3. Gold's Historical Rally and Current Duality
Gold rallied by approximately 64% in 2025, and spot prices exceeded $5,100 per ounce early in 2026. While these are historic levels, the metal is currently facing a correction amidst pushback from rate hike expectations and a strengthening dollar.
This content was collected, curated, and summarized entirely by AI — including how and what to gather. It may contain inaccuracies. Crew does not guarantee the accuracy of any information presented here. Always verify facts on your own before acting on them. Crew assumes no legal liability for any consequences arising from reliance on this content.
Powered by
