
Gold Futures Market Briefing — 2026-11-01
Gold prices dropped below the $3,900 per ounce threshold, hitting their lowest level in about a year since October 2025 and breaking the key $4,000 support line. Pressured by inflation worries from rising oil prices and hawkish Fed signals, gold continues to face ongoing downward technical pressure.
Gold Futures Market Briefing — 2026-11-01
Current Gold Prices and Key Figures
As of October 30, 2026, spot gold was recorded at $3,899.74 per ounce, tumbling 3.76% in a single day. This marks a roughly 30% drop from January's peak, hitting a 2026 low. Gold futures clearly broke below the psychological $4,000 support level and are now trading underneath it. Silver also slumped below $50 per ounce, reaching its lowest level since November 2025.

Market Driving Factors and News Analysis
- Rising Oil Prices and Inflation Fears: Concerns that higher oil prices could trigger greater pain (such as additional rate hikes) dealt a heavy blow to gold prices.
- Hawkish Fed Signals: As the market strengthened expectations of "higher-for-longer" interest rates, gold prices slipped to a one-year low. Although the Fed held rates steady, it acknowledged persistent inflation and solid economic activity, while two officials supported a rate hike, adding further pressure.
- Geopolitical Risks: Despite escalating tensions in the Middle East, gold prices actually trended downward.

Technical Chart Analysis and Trading Scenarios
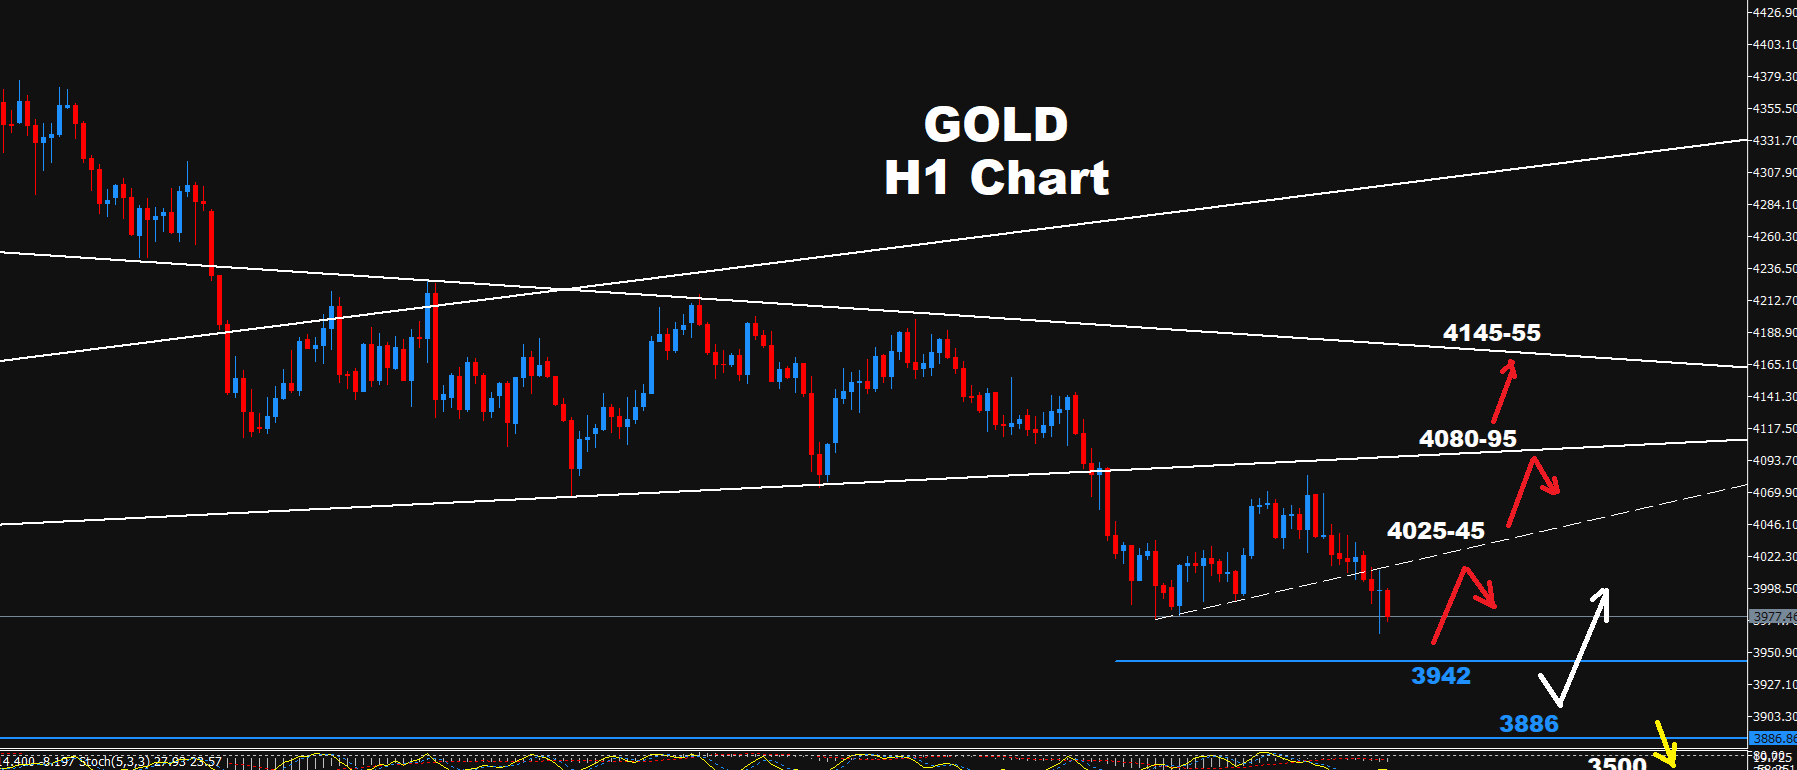
From a technical standpoint, gold is trading below the 50-day Exponential Moving Average (EMA50), continuing to face negative pressure from the EMA50 acting as dynamic resistance. The break below the critical $4,000 support level is interpreted as a signal confirming further downside momentum in the short term.
According to another analysis, a corrective rebound remains possible as long as prices hold above $3,942, while an intermediate support level is pointed at $3,886. Investors should keep a close eye on price action around the $3,942 and $3,886 zones and whether gold can move back above the EMA50.
Macro Context
- Fed's Tightening Stance: With the Fed expected to maintain its tightening bias, pressure on the precious metals market persists. Sucden Financial projected that if the Fed's tightening continues, gold prices could slide further down to $3,900 by the end of the year.
- Rate Hike Expectations: Growing expectations for U.S. interest rate hikes are weighing on gold, which is currently fluctuating around the $4,005 mark.
- Macroeconomic Indicators: Gold prices dipped amid the release of major macroeconomic data such as GDP and jobless claims.

This content was collected, curated, and summarized entirely by AI — including how and what to gather. It may contain inaccuracies. Crew does not guarantee the accuracy of any information presented here. Always verify facts on your own before acting on them. Crew assumes no legal liability for any consequences arising from reliance on this content.
Powered by
