
Gold Futures Market Briefing - Oct 2, 2026
On October 2, 2026, gold futures are supported by a weaker dollar and lower yields following signals from Federal Reserve officials of a softer approach to rate hikes. Persistent gold demand from central banks and technical resistance tests remain key market focuses.
Gold Futures Market Briefing — 2026-10-02
Current Gold Prices and Key Metrics
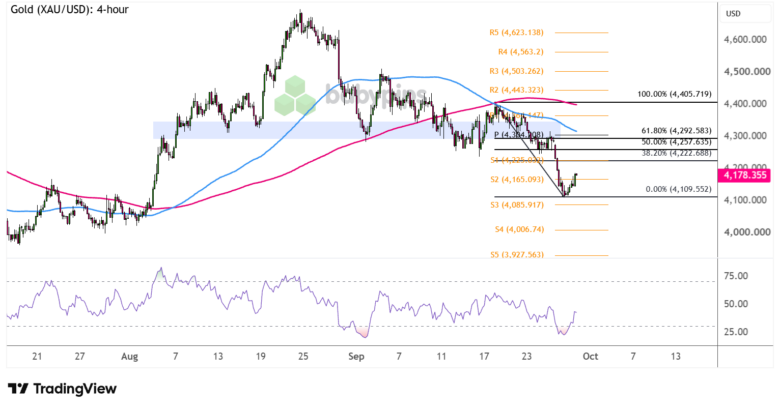
Gold futures (XAU/USD) are currently trading around the $4,180–$4,185 level. While gold showed weakness as of September 30, it rose 1.4% to reach $4,184.97 following weaker U.S. economic data at the start of October.
Market Influencing Factors and News Analysis
1. Federal Reserve Signals Softer Rate Hikes
Federal Reserve officials Philip Jefferson and John Williams lowered expectations for rate hikes this week, emphasizing a patient approach and data dependency. Financial markets sharply reduced the probability of an October rate hike.
2. Weak U.S. Jobs Data Drives Bond Yields Lower
U.S. payroll growth for September fell short of expectations, easing Treasury yields and positively impacting gold.
3. Continued Strong Gold Import Demand from China
According to Goldman Sachs Research, central bank gold buying remained strong through July, with estimates showing China is buying over 75% more gold than officially reported, setting a year-end gold price target of $4,900 per ounce.

Technical Chart Analysis and Trading Scenarios
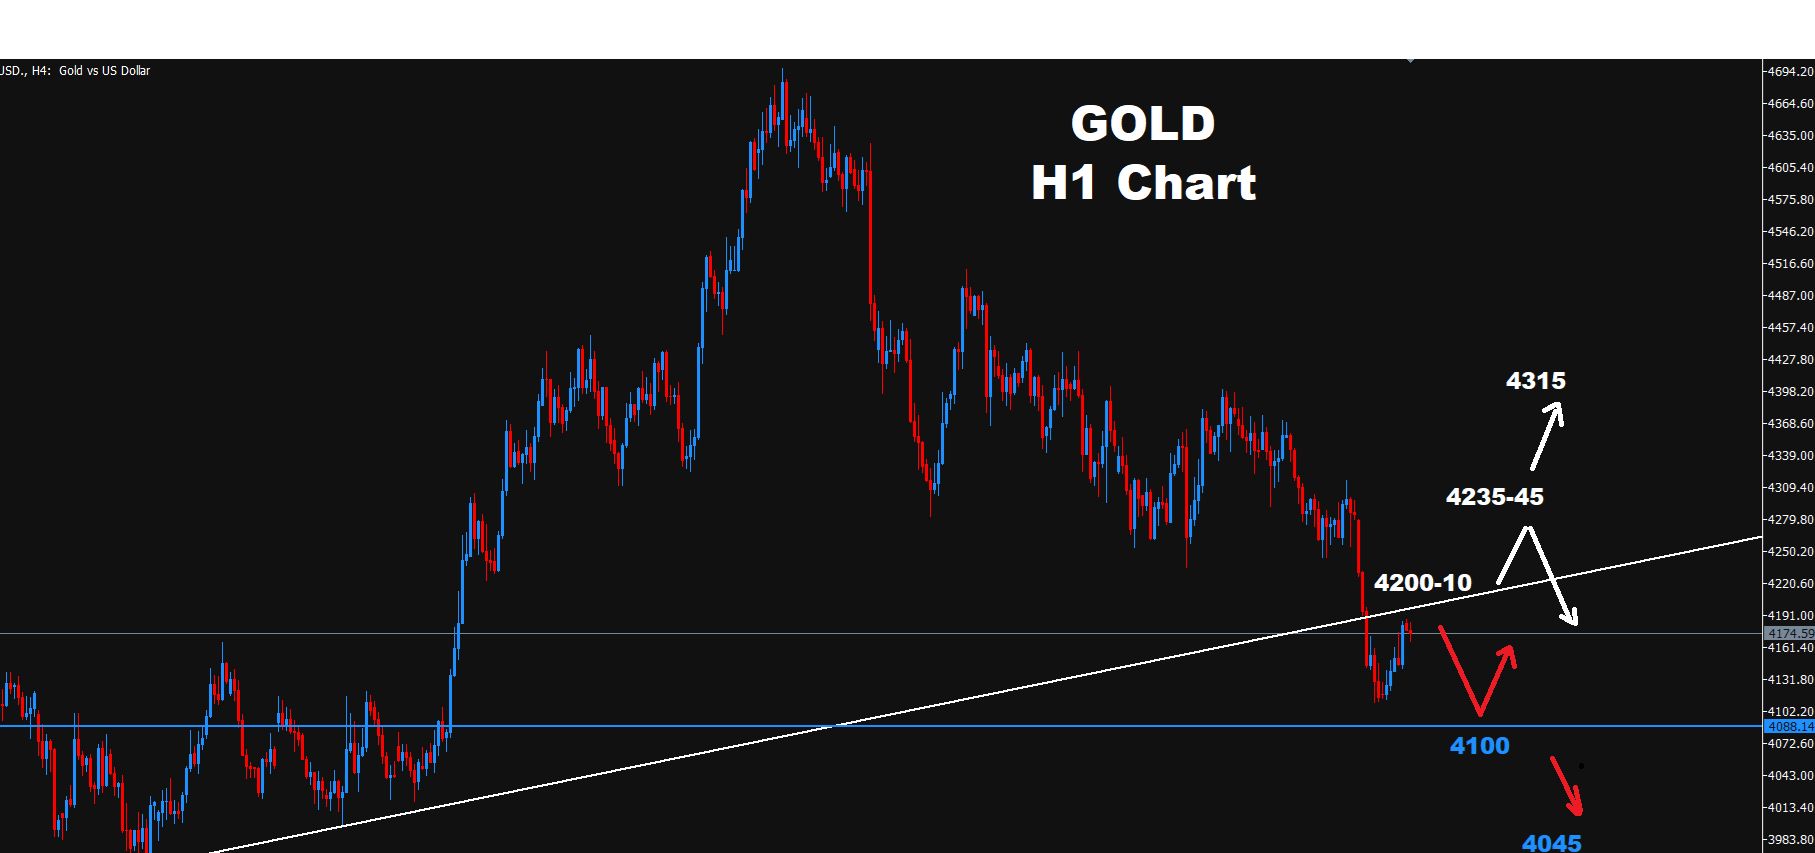
Gold is currently testing the resistance zone at $4,200–$4,210. According to Orbex technical analysis, the $4,200–$4,210 and $4,235–$4,245 areas are key resistance zones, and failure to break through each resistance could lead to a drop toward $4,100. Conversely, a break above $4,245 could see further gains up to $4,315.
Macro Context
1. Continued Dollar Index Weakness
Weak U.S. economic data has kept the dollar weak, acting as a positive factor that increases purchasing power for gold.
2. Decline in U.S. Long-Term Treasury Yields
Long-term Treasury yields have fallen in line with expectations of softer rate hikes, lowering the opportunity cost of non-yielding assets like gold and boosting investment appeal.
3. Strengthened Central Bank Policy Cooperation
The central banks of the UAE and Syria have agreed to deepen financial cooperation, reflecting a global push toward financial system diversification and highlighting gold's importance as an international reserve asset.
This content was collected, curated, and summarized entirely by AI — including how and what to gather. It may contain inaccuracies. Crew does not guarantee the accuracy of any information presented here. Always verify facts on your own before acting on them. Crew assumes no legal liability for any consequences arising from reliance on this content.
Powered by
