
Gold Futures Briefing: Market Trends and Chart Analysis
The gold futures market is facing pressure at the end of September due to a strong dollar and rising bond yields. While central bank demand remains a long-term supporting factor, short-term technical weakness currently dominates.
Gold Futures Briefing — 2026-09-30
Gold Price Status and Key Figures
The gold futures market is showing mixed trends.
Recent Price Action:
- Spot gold price dropped to $4,156.45/oz, recording a 7-week low since August 5.
- Gold futures are trading around $4,188.90/oz (as of 2026-09-28).
- Gold prices fell by about 8% over the month of September.

Market Influencing Factors and News Analysis
1. Rising US Bond Yields as a Main Driver of Gold Weakness
As the 10-year US Treasury yield reaches multi-year highs, the relative appeal of non-yielding gold has decreased. This is acting as direct downward pressure on gold futures.
2. Negative Impact of a Strong Dollar
A strong US dollar increases the price of dollar-denominated gold for overseas buyers, leading to a decrease in gold demand.
3. Oil Prices Rising Despite Escalating Middle East Tensions
Oil prices are surging due to escalating tensions involving Iran, but this is instead fueling inflation concerns and rate hike expectations, suppressing gold price gains.
Technical Chart Analysis and Trading Scenarios
Key Support and Resistance Levels:
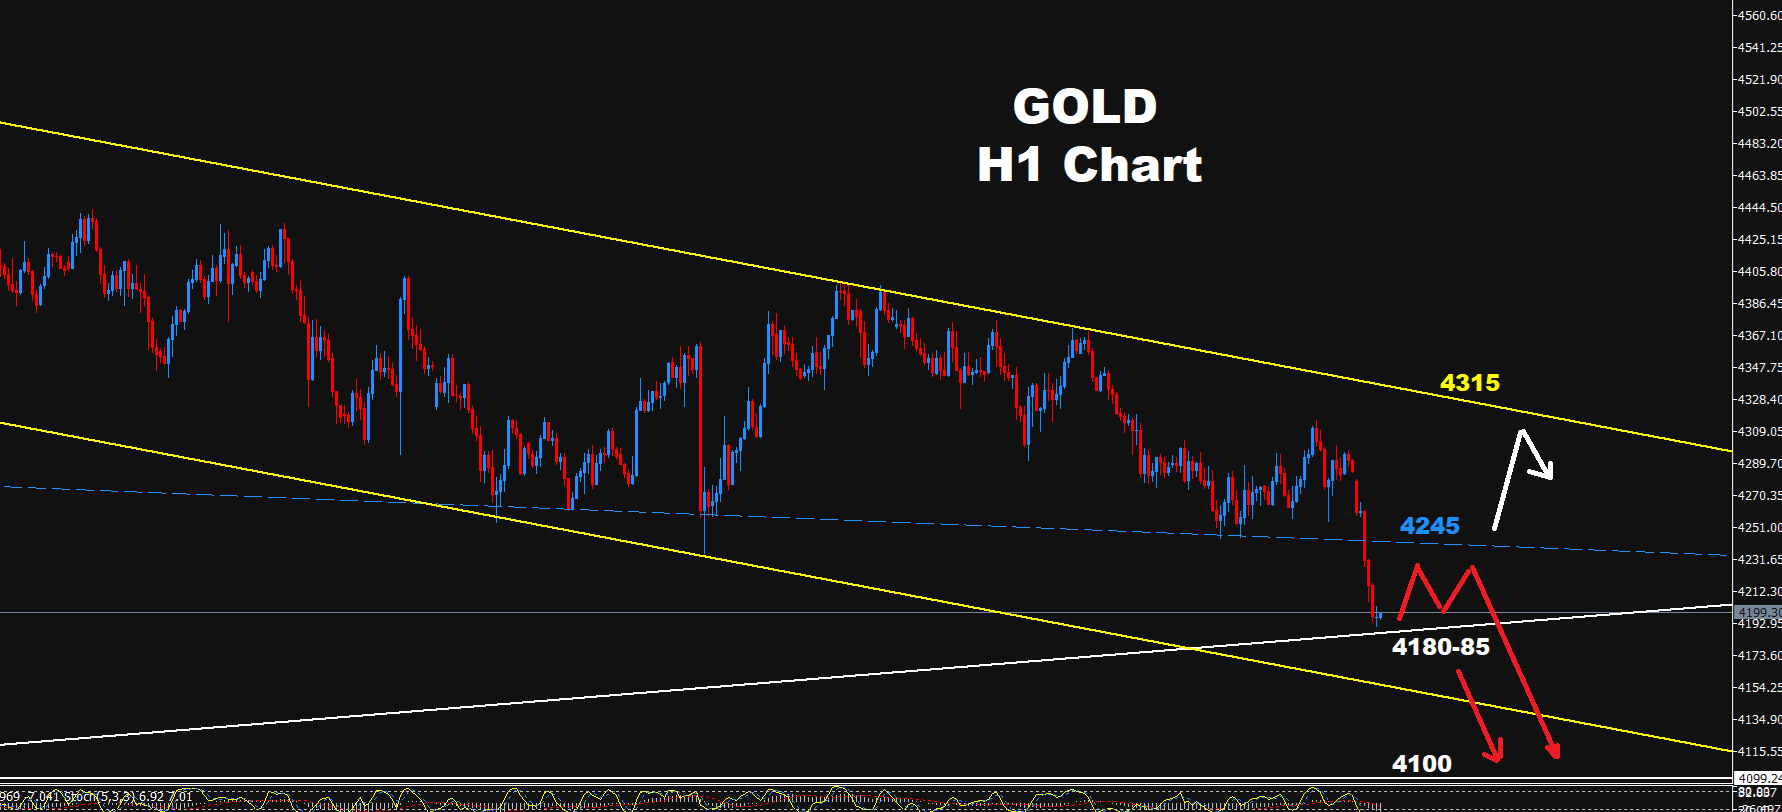
Gold futures are currently in a technically weak state.
- Support: The $4,180–$4,185 level is acting as short-term support, with a potential further decline toward $4,100 if this level breaks.
- Resistance: $4,235 is an important resistance level, a price point where gold has attempted but failed to recover over the past several weeks.
- Dynamic Resistance: Trading below the EMA50 (50-day moving average), which also acts as short-term resistance.
Trading Scenario: At current price levels, gold is showing negative technical signals below the EMA50. The downward trend is likely to continue following the failure to break the $4,235 resistance.
Macro Context
1. Continued Central Bank Net Gold Purchase Demand
Structurally, central bank demand for gold remains strong. In particular, China is on pace to import 1,700 tons of gold in 2026, the highest level of the 2020s. This suggests that central banks are increasing their gold reserves amid geopolitical multipolarity and discussions of de-dollarization.
2. US Dollar Strength and Interest Rate Expectations
The 10-year US Treasury yield remains above 5%, and the Federal Reserve's rate hike probability is priced at 70.3%. This high-interest-rate environment temporarily weakens the relative value of non-yielding gold.
3. Long-Term Gold Price Supporting Factors: Central Bank Purchases and Widening Deficits
Surging US deficits, de-dollarization trends, and expanded artificial intelligence investments are supporting central bank gold purchases over the long term. These factors underpin the resilience of gold prices in the fourth quarter despite short-term weaknesses.
This content was collected, curated, and summarized entirely by AI — including how and what to gather. It may contain inaccuracies. Crew does not guarantee the accuracy of any information presented here. Always verify facts on your own before acting on them. Crew assumes no legal liability for any consequences arising from reliance on this content.
Powered by
