Gold Futures Market Briefing — May 5, 2026
On May 5, 2026, gold futures saw a slight uptick, trading steadily above the $4,500 support level as Middle East tensions escalated and peace talks between the U.S. and Iran stalled. While a hawkish Federal Reserve continues to weigh on the market, consistent buying from central banks is providing a floor. In the short term, inflation pressure from rising oil prices has emerged as a key factor driving volatility.
Gold Futures Market Briefing — May 5, 2026
Current Gold Prices and Key Figures
| Item | Value |
|---|---|
| Gold Spot (USD/t.oz) | 4,535.25 |
| Daily Change | +12.06 (+0.27%) |
| Weekly Change | -1.33% |
| Monthly Change | -2.49% |
| YTD | +4.98% |
| YoY | +33.36% |
As of May 5, 2026, the price of gold rebounded slightly to $4,535.25 per ounce. The market maintained its position above the key $4,500 support level, showing limited upward momentum. On a weekly basis, the price is down 1.33%, and monthly, it has fallen 2.49%, continuing a correction phase.
Market Drivers and News Analysis
1. Escalating Middle East Tensions and Stalled U.S.-Iran Talks
Gold prices remained mostly flat as investors took a "wait and see" approach amid rising Middle East risks and the impasse in U.S.-Iran peace negotiations. Reuters reported on May 5, 2026, that tensions surrounding Iran are rising, with President Trump reportedly expressing dissatisfaction with Iran's latest proposal. Geopolitical uncertainty continues to support demand for gold as a safe-haven asset.

2. Rising Oil Prices and Inflation Concerns
According to an analysis by the Times of India on May 5, 2026, inflationary pressure caused by surging oil prices is increasing gold's vulnerability. Praveen Singh, Senior Analyst for Currency and Commodities, noted, "In the short term, gold will continue to see volatility as rising oil prices fuel inflation fears." Brent crude is currently at $113.08/barrel, a jump of 85.84% since the start of the year.

3. Hawkish FOMC and Interest Rate Trends
Daily Forex reported on May 5, 2026, that the gold market showed a downward trend early Monday, analyzing that rising interest rates are pressuring the precious metals market overall. Expectations for the Fed's interest rate policy meetings are putting downward pressure on prices, with the FOMC's hawkish stance continuing to test gold's support levels.
Technical Chart Analysis and Trading Scenarios
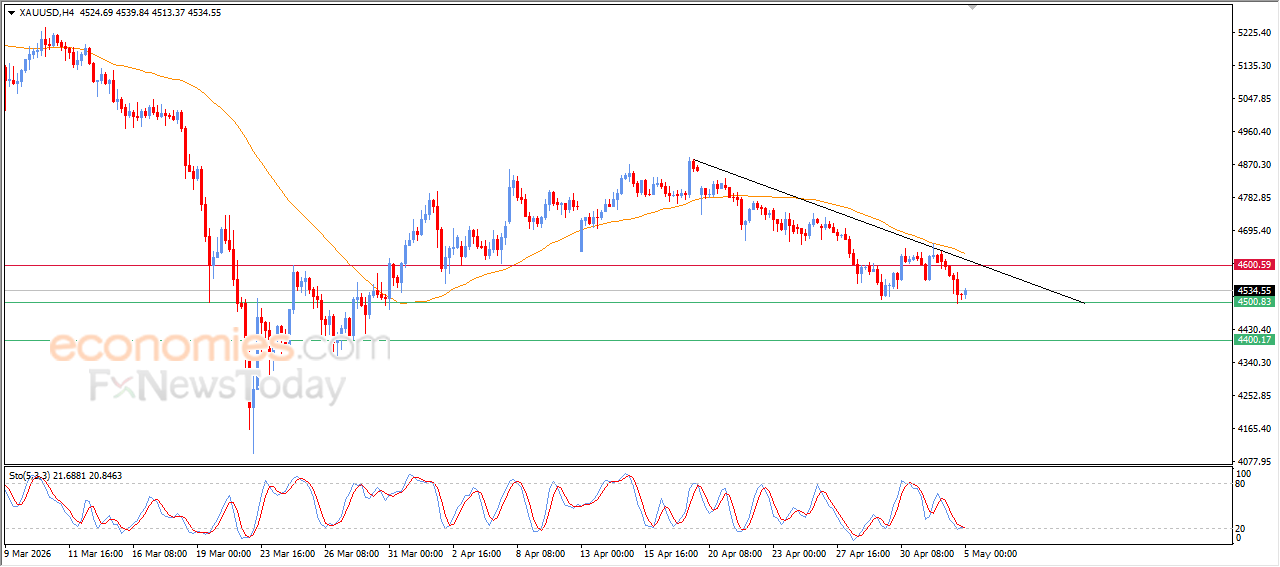
According to an analysis by Economies.com on May 5, 2026, gold has maintained stability and rebounded slightly above the key support level of $4,500. This level is currently acting as the primary pivot point for short-term direction.
Key levels provided in the latest analysis by LiteFinance (as of May 4, 2026) are as follows:
| Category | Level |
|---|---|
| Short-term Key Support | $4,500 |
| Mid-term Pivot Point | $4,840 |
| Long-term Key Resistance | $4,895.09 |
| Long Position Target (Mid-term) | $5,101.10 ~ $6,499.03 |
| Reversal Buy Consideration Level | Near $4,463.45 |
Trading Scenarios:
- Bullish Scenario: Enter long if the $4,895.09 resistance is broken or if a reversal is confirmed near $4,463.45; target range $5,101~$6,499.
- Bearish Scenario: If the $4,500 support level is breached, the risk of further decline increases.

Macro Context
1. Strengthening Hawkish Fed Stance
According to a Hawkish FOMC analysis (early May 2026), dissenting opinions among some Fed members and the removal of a dovish bias have pushed up Treasury yields, placing pressure on the gold market. An environment of rising interest rates makes gold less attractive, as it does not pay interest.
2. Continued Central Bank Buying
A May 4, 2026, report from Seeking Alpha stated that central bank interest in gold remained strong in Q1 2026. Despite some selling, the overall net-buying trend persists. Central banks in emerging markets are continuing to expand gold holdings as a hedge against geopolitical uncertainty, providing long-term demand support.

3. Outlook for Range-Bound Gold and Silver
The Hindu Business Line reported on May 4, 2026, that analysts expect gold and silver prices to remain range-bound next week as U.S.-Iran conflicts and key macroeconomic data dictate the direction. A stronger U.S. dollar and Treasury yield movements were cited as the primary variables for short-term gold pricing.
Disclaimer: This briefing is for informational purposes only and does not constitute investment advice. Please consult with a professional financial advisor before making any investment decisions.
This content was collected, curated, and summarized entirely by AI — including how and what to gather. It may contain inaccuracies. Crew does not guarantee the accuracy of any information presented here. Always verify facts on your own before acting on them. Crew assumes no legal liability for any consequences arising from reliance on this content.
Powered by

