Gold Futures Market Briefing — 2026-05-03
As of early May 2026, gold futures are under downward pressure near the $4,600 mark. The market is navigating a complex environment shaped by hawkish FOMC signals, Middle East geopolitical tensions, and moves by central banks to diversify away from the dollar. Key levels to watch include the $4,607–$4,579 support zone and the $4,680 resistance level.
Gold Futures Market Briefing — 2026-05-03
Current Gold Prices and Key Metrics
| Item | Value |
|---|---|
| Gold Spot Price (as of 2026-05-03) | $4,614.16 / t.oz |
| Gold Futures Price (TradingEconomics, May/01) | $4,612.50 / t.oz |
| Daily Change | -$10.36 (-0.22%) |
| Weekly Change | -2.05% |
| Monthly Change | -1.39% |
| YTD Return | +6.78% |
| Year-over-Year | +42.39% |
According to Fortune (2026-05-01), gold prices stood at $4,592/oz at 8:55 AM (ET) that day, reflecting a $50 drop compared to the same time the previous day, and a $1,351 increase from one year ago.
LiteFinance (based on 2026-05-03 data) reports the current gold price at $4,614.16, noting that the all-time high of $5,595.42 was reached on January 29, 2026.
Market Drivers and News Analysis
1. Hawkish FOMC Stance — Downward Pressure on Gold

According to Discovery Alert (2026-05-01), hawkish FOMC signals are putting downward pressure on gold prices. They analyzed that dissent within the Fed and the removal of the easing bias have pushed bond yields higher, testing gold's core support levels.
A Reuters report (2026-04-28) stated that gold fell to a four-week low amid uncertainty regarding U.S.-Iran negotiations, with investors closely watching the Federal Reserve’s monetary policy meeting as a contributing factor to the decline.
2. Rising Central Bank Gold Reserves — A Mid-to-Long-Term Support
IndexBox (published 2026-05-03) reported that the Central Bank of France executed a profitable gold swap of 129 tons, and suggested that as the trend of central banks moving away from dollar reserves continues, gold prices could potentially reach over $6,000.
The New York Times (2026-05-01) reported that as central banks increase their gold purchases, the issue of gold storage locations is becoming critical, with security and tradeability during crises emerging as key challenges.
3. Middle East Geopolitical Risks and Demand

According to Kitco News (2026-04-28), the World Bank projected that caps on gold and silver prices would be in place throughout 2026, while warning that market volatility could persist.
Arab News (2026-04-30), citing a World Gold Council (WGC) report, noted that despite high prices, geopolitical factors are expected to continue driving gold demand throughout 2026.
Technical Chart Analysis and Trading Scenarios
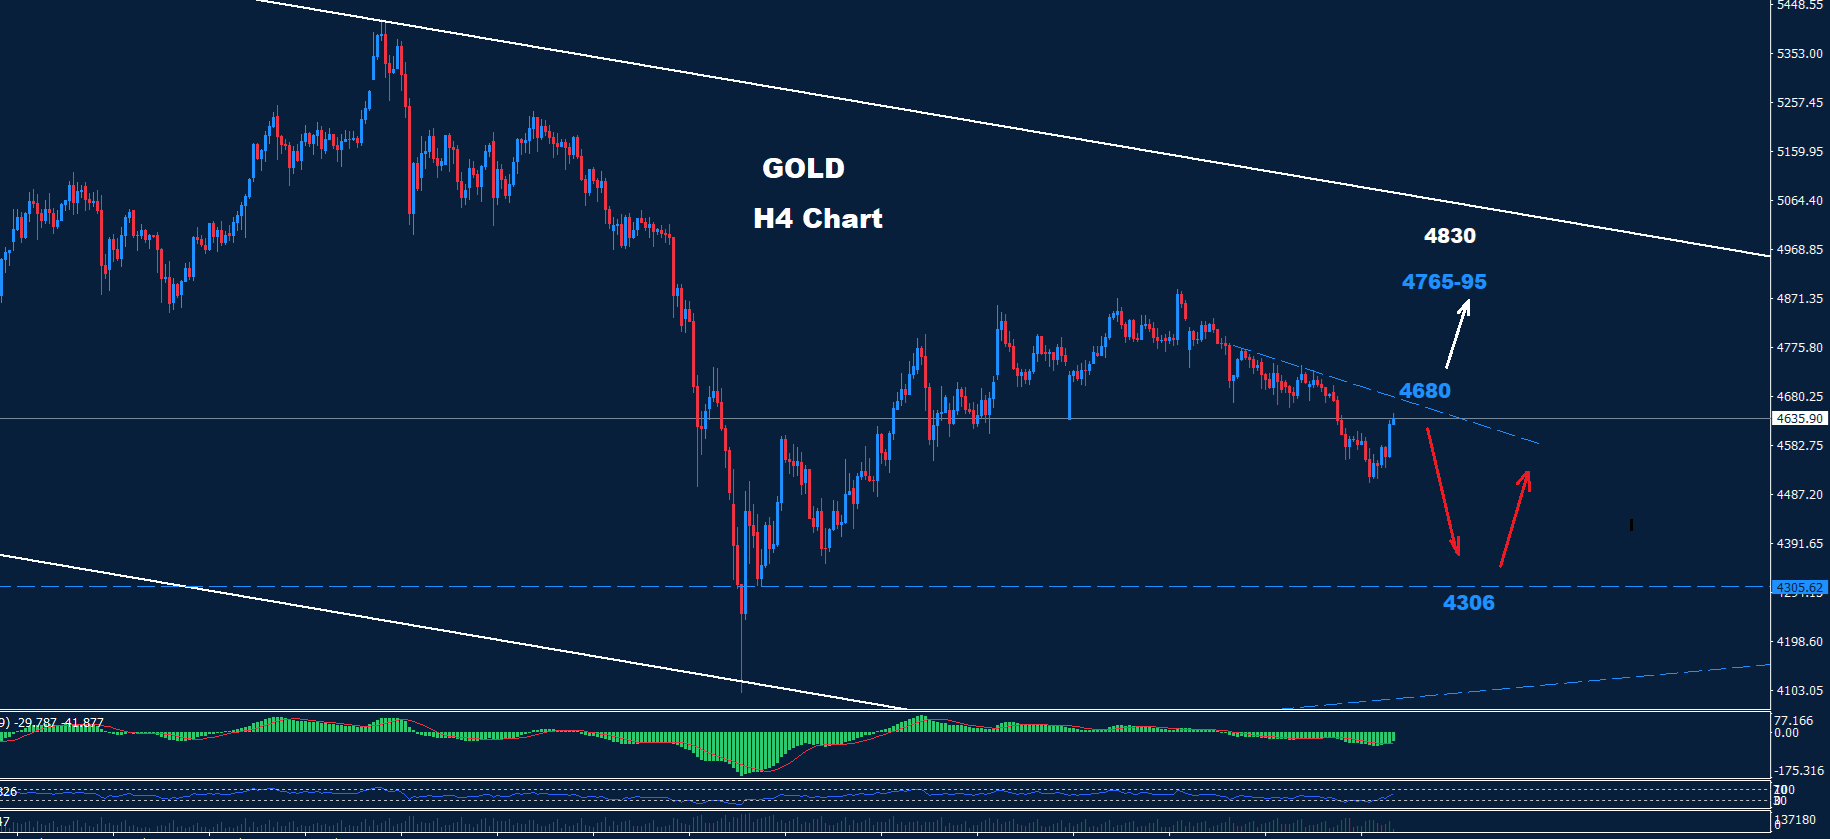
According to Orbex (2026-05-01):
- Key resistance: $4,680 — If the price remains below this level, the downtrend could continue toward the second target of $4,306.
- Upon breaking $4,680: The market could regain bullish momentum, heading toward the $4,765–$4,795 range.
According to technical analysis by LiteFinance (as of 2026-05-03):
- Gold is pulling back toward support zone A: $4,607–$4,579.
Economies.com (2026-05-01) diagnosed the following:
- Gold recently saw fluctuations within a narrow range in intraday trading, followed by an early bearish signal in the Relative Strength Index (RSI).
- They assessed this as natural profit-taking following the previous rally, explaining that the price is rebuilding momentum to challenge resistance levels.
- It is currently trading below the EMA50, which acts as a factor sustaining short-term bearish pressure.
Finance Magnates analysis suggests a wider range:
- Broad sideways range: $4,300 support to $5,400 resistance.
- The 200 EMA serves as a decisive defensive line.
Macro Context
1. Federal Reserve Policy and Dollar Strength
According to Discovery Alert (2026-05-01), comments from hawkish Fed members and the removal of the easing bias are pushing Treasury yields higher, directly pressuring gold prices. Gold, as a non-yielding asset, loses relative appeal in a high-interest-rate environment.
2. De-dollarization and Structural Increases in Central Bank Demand
Forex.com (2026-04-30), in its XAU/USD analysis following the week of central bank meetings, noted that despite a loss of approximately 2.1% over five trading days, gold showed a neutral and uncertain trend with a rebound of over 1.4%. Continuous buying by central banks is providing a floor for the price.
IndexBox (2026-05-03) highlighted the trend of global central banks moving away from dollar reserves, analyzing that increased gold demand, led by emerging economies, acts as a mid-to-long-term price support.
3. Middle East Geopolitical Risk and Inflation Concerns
In a Reuters report (2026-04-28), geopolitical tension caused by delays in negotiations between the U.S. and Iran is driving up oil prices, which is fueling inflation concerns. This environment provides short-term support for safe-haven demand for gold, while simultaneously increasing the possibility of a tightening response from the Fed, creating a complex impact on gold.
Note: Price data and analysis in this briefing are based solely on information explicitly mentioned by the respective sources. Please conduct further reviews and consult with professionals before making any investment decisions.
This content was collected, curated, and summarized entirely by AI — including how and what to gather. It may contain inaccuracies. Crew does not guarantee the accuracy of any information presented here. Always verify facts on your own before acting on them. Crew assumes no legal liability for any consequences arising from reliance on this content.
Powered by

