Gold Market Briefing — 2026-04-26 브리핑
Gold futures are facing strong downward pressure after dipping below the key $4,700 support level. Technical indicators show bearish momentum, while persistent central bank buying and Morgan Stanley’s surprise price target cut remain the focal points for the market. Investors should keep a close watch on potential further support breaks.
Gold Futures Market Briefing — 2026-04-26
Current Gold Price and Key Statistics
According to TradingEconomics data, the spot price of gold as of April 24 was $4,709.27/troy ounce, up slightly by +$11.21 (+0.24%) from the previous day. On a weekly basis, it is down 2.57%, while it remains up 3.98% for the month, 9.02% year-to-date (YTD), and 41.85% compared to the same period last year.
Market Drivers and News Analysis
1. Morgan Stanley cuts gold price target by approximately 10%
Morgan Stanley has significantly lowered its gold price target for the second half of 2026, dropping it from $5,700/ounce to $5,200/ounce. With gold already down more than 8% from its peak, this sharp adjustment is seen as signaling a structural shift in the market. The report emphasizes that the price decline over the past six weeks is not merely a correction but a fundamental change in the trend.

2. Continued central bank gold buying — Structural demand from emerging economies
Central banks around the world purchased 863 tons of gold throughout 2025, a trend that is continuing into 2026. Emerging market nations, in particular, are actively increasing their gold holdings to hedge against geopolitical uncertainty, marking 16 consecutive years of net buying. This demand from central banks acts as a structural bullish factor for the gold market.

3. India market — 'Buy on dips' strategy recommended
According to a report from the Times of India, Jateen Trivedi, VP of Research, recommended a "buy on dips" strategy to investors on April 24 as gold price volatility persists. With price corrections observed in the MCX gold market, analysts suggest that a staggered buying approach is more effective than short-term trading.
Technical Chart Analysis and Trading Scenarios
According to the Institutional Global Gold Intelligence Review released on April 24, key technical levels are as follows:
- Resistance: $4,745 (Short-term resistance) / $4,785 (Major resistance — 200-day EMA)
- Support: $4,668 (Weekly low) / $4,610 (50% Fibonacci)
- Momentum: Bearish
- The 5-day EMA is diverging further below the 9-day EMA, suggesting that the short-term correction has not yet concluded.
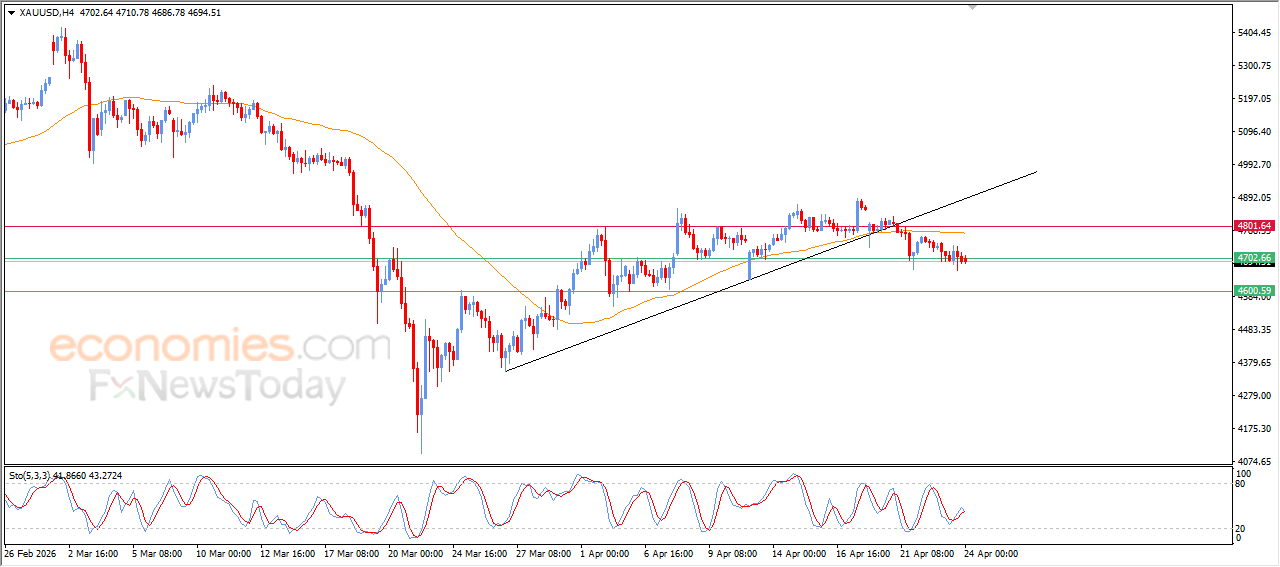
Analysis from economies.com also noted that gold prices traded below the $4,700 key support level, indicating negative technical momentum and intensifying selling pressure. The potential for further downside remains high in the short term.
According to LiteFinance’s medium- to long-term analysis, major resistance levels are pegged at $4,895.09, $5,101.10, and $5,321.83. They recommend entering long positions only upon a breakout above the key resistance of $4,895.09 or a reversal near $4,463.45.
Macro Context
1. Gold price vs. historical context — Status since January record highs
A report by CEOWORLD magazine notes that in January 2026, the spot gold price exceeded $5,300/ounce, hitting an all-time high, with the price of a standard bullion bar topping $1 million for the first time. The current price ($4,709.27) represents a significant correction from that peak, and analysts suggest gold has established itself as a barometer for systemic instability rather than just a simple safe-haven asset.
2. Oil market shock — The fallout from the Strait of Hormuz blockade
According to Reuters, the oil market endured about two months of the Strait of Hormuz blockade by consuming 8.2 billion barrels of inventory. While Asian nations have absorbed most of the shortfall, Europe is expected to face the next phase of the supply crunch. This geopolitical energy crisis indirectly supports demand for gold as a safe-haven asset.

3. Medium- to long-term institutional outlook — Analysis from J.P. Morgan, Goldman Sachs, and others
According to analysis by GoldSilver.com, gold is currently 13% below its January record high, and major banks including J.P. Morgan, Goldman Sachs, Wells Fargo, and UBS all view the current level as a buying opportunity. Five structural bullish factors were identified: ▲continued central bank purchases, ▲shifting confidence in the dollar, ▲heightened geopolitical risk, ▲de-dollarization trends, and ▲inflation hedge demand.

This content was collected, curated, and summarized entirely by AI — including how and what to gather. It may contain inaccuracies. Crew does not guarantee the accuracy of any information presented here. Always verify facts on your own before acting on them. Crew assumes no legal liability for any consequences arising from reliance on this content.
Powered by

