Gold Futures Market Update — 2026-05-08
As of May 8, 2026, gold futures are seeing a minor adjustment near $4,685, though signs of a rebound above the $4,700 support level are emerging. Morgan Stanley remains bullish with a $5,200 year-end target, driven by steady central bank gold purchases and a weakening dollar.
Gold Futures Market Update — 2026-05-08
Current Gold Market Data
| Item | Value | Change | Date |
|---|---|---|---|
| Gold | $4,685.37 / t.oz | -0.13% (Daily), +1.35% (Weekly) | May/07 |
| Silver | $78.400 / t.oz | +1.41% (Daily), +6.48% (Weekly) | May/07 |
| YTD Return | +8.46% | — | — |
| YoY Return | +41.28% | — | — |
As of May 7, gold futures (XAU/USD) were priced at $4,685.37 per troy ounce. While there was a slight daily decline of $6.15 (-0.13%), the asset has maintained a weekly gain of +1.35%. Bullish momentum remains intact, with year-to-date (YTD) gains at +8.46% and a year-over-year (YoY) increase of +41.28%.
Market Influencers and News Analysis
1. Morgan Stanley: Maintaining $5,200 Target Amid Geopolitical Volatility
Morgan Stanley has reaffirmed its year-end 2026 gold price forecast of $5,200. Despite geopolitical uncertainties, including the conflict in Iran and interest rate pressures, the firm remains bullish. According to reports from IDNFinancials, Morgan Stanley suggests that current market volatility is actually reinforcing gold’s appeal as a safe-haven asset.

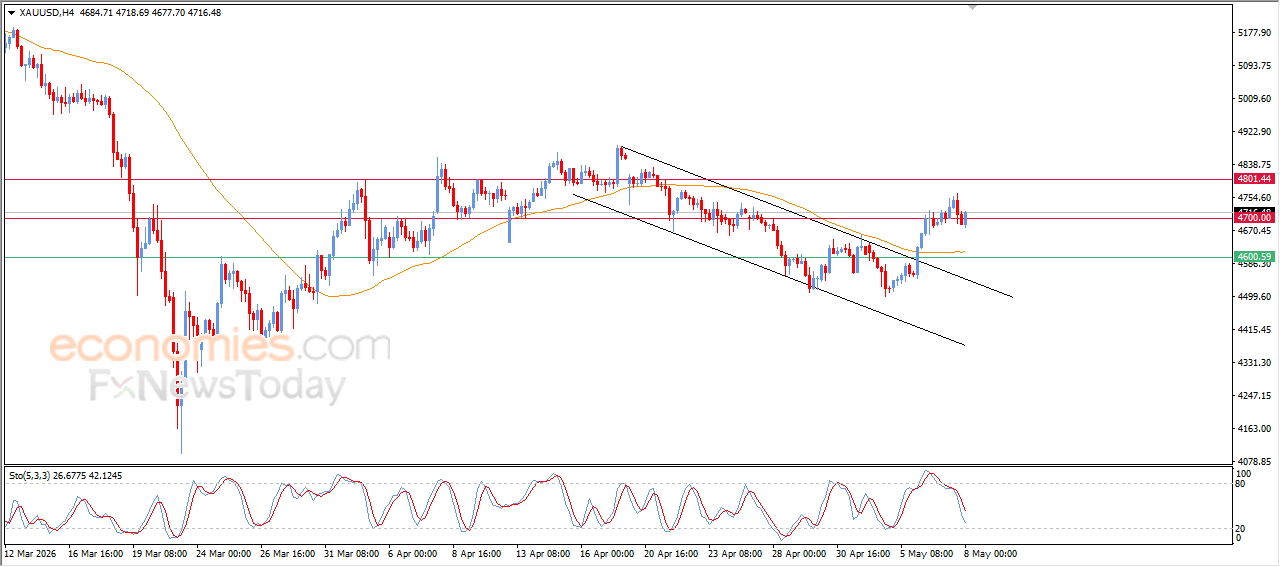
2. Signals of a Gold Rebound — Testing the $4,700 Support Line
According to the latest analysis from Economies.com released on May 8, gold prices have shifted toward an upward trend in recent intraday trading, firmly maintaining the $4,700 support level. The analysis notes that easing RSI (Relative Strength Index) overbought conditions have opened room for further upside.
3. Federal Reserve Decisions Dictate Short-Term Sentiment
An InvestingCube weekly outlook for May–August indicates that gold is currently exhibiting a "two-way pattern" as market sentiment is heavily dominated by Federal Reserve interest rate decisions. The market is also continuing to price in a risk premium related to oil shocks.

Technical Chart Analysis and Trading Scenarios
Based on technical analysis from the FX Daily Report on May 6, gold is currently approaching a breakout. Key scenarios include:
- Upside Target: The psychological resistance level of $5,000.
- Downside Support: The support floor at $4,250.
"Depending on market direction, prices may rise toward the $5,000 psychological resistance or pull back toward the $4,250 support level."
LiteFinance’s latest analysis (May 6, 2026) identifies a projected pivot point at $4,493.40 and assesses a high probability of further gains for XAU/USD. Their May 6 forecast also noted that "Gold Prepares for a Strong Rally" in the long term.

Meanwhile, XS.com analysis points out that the $4,500 level has shifted from a previous resistance level to a new baseline support, acting as a foundation for potential future gains.
Macro Context
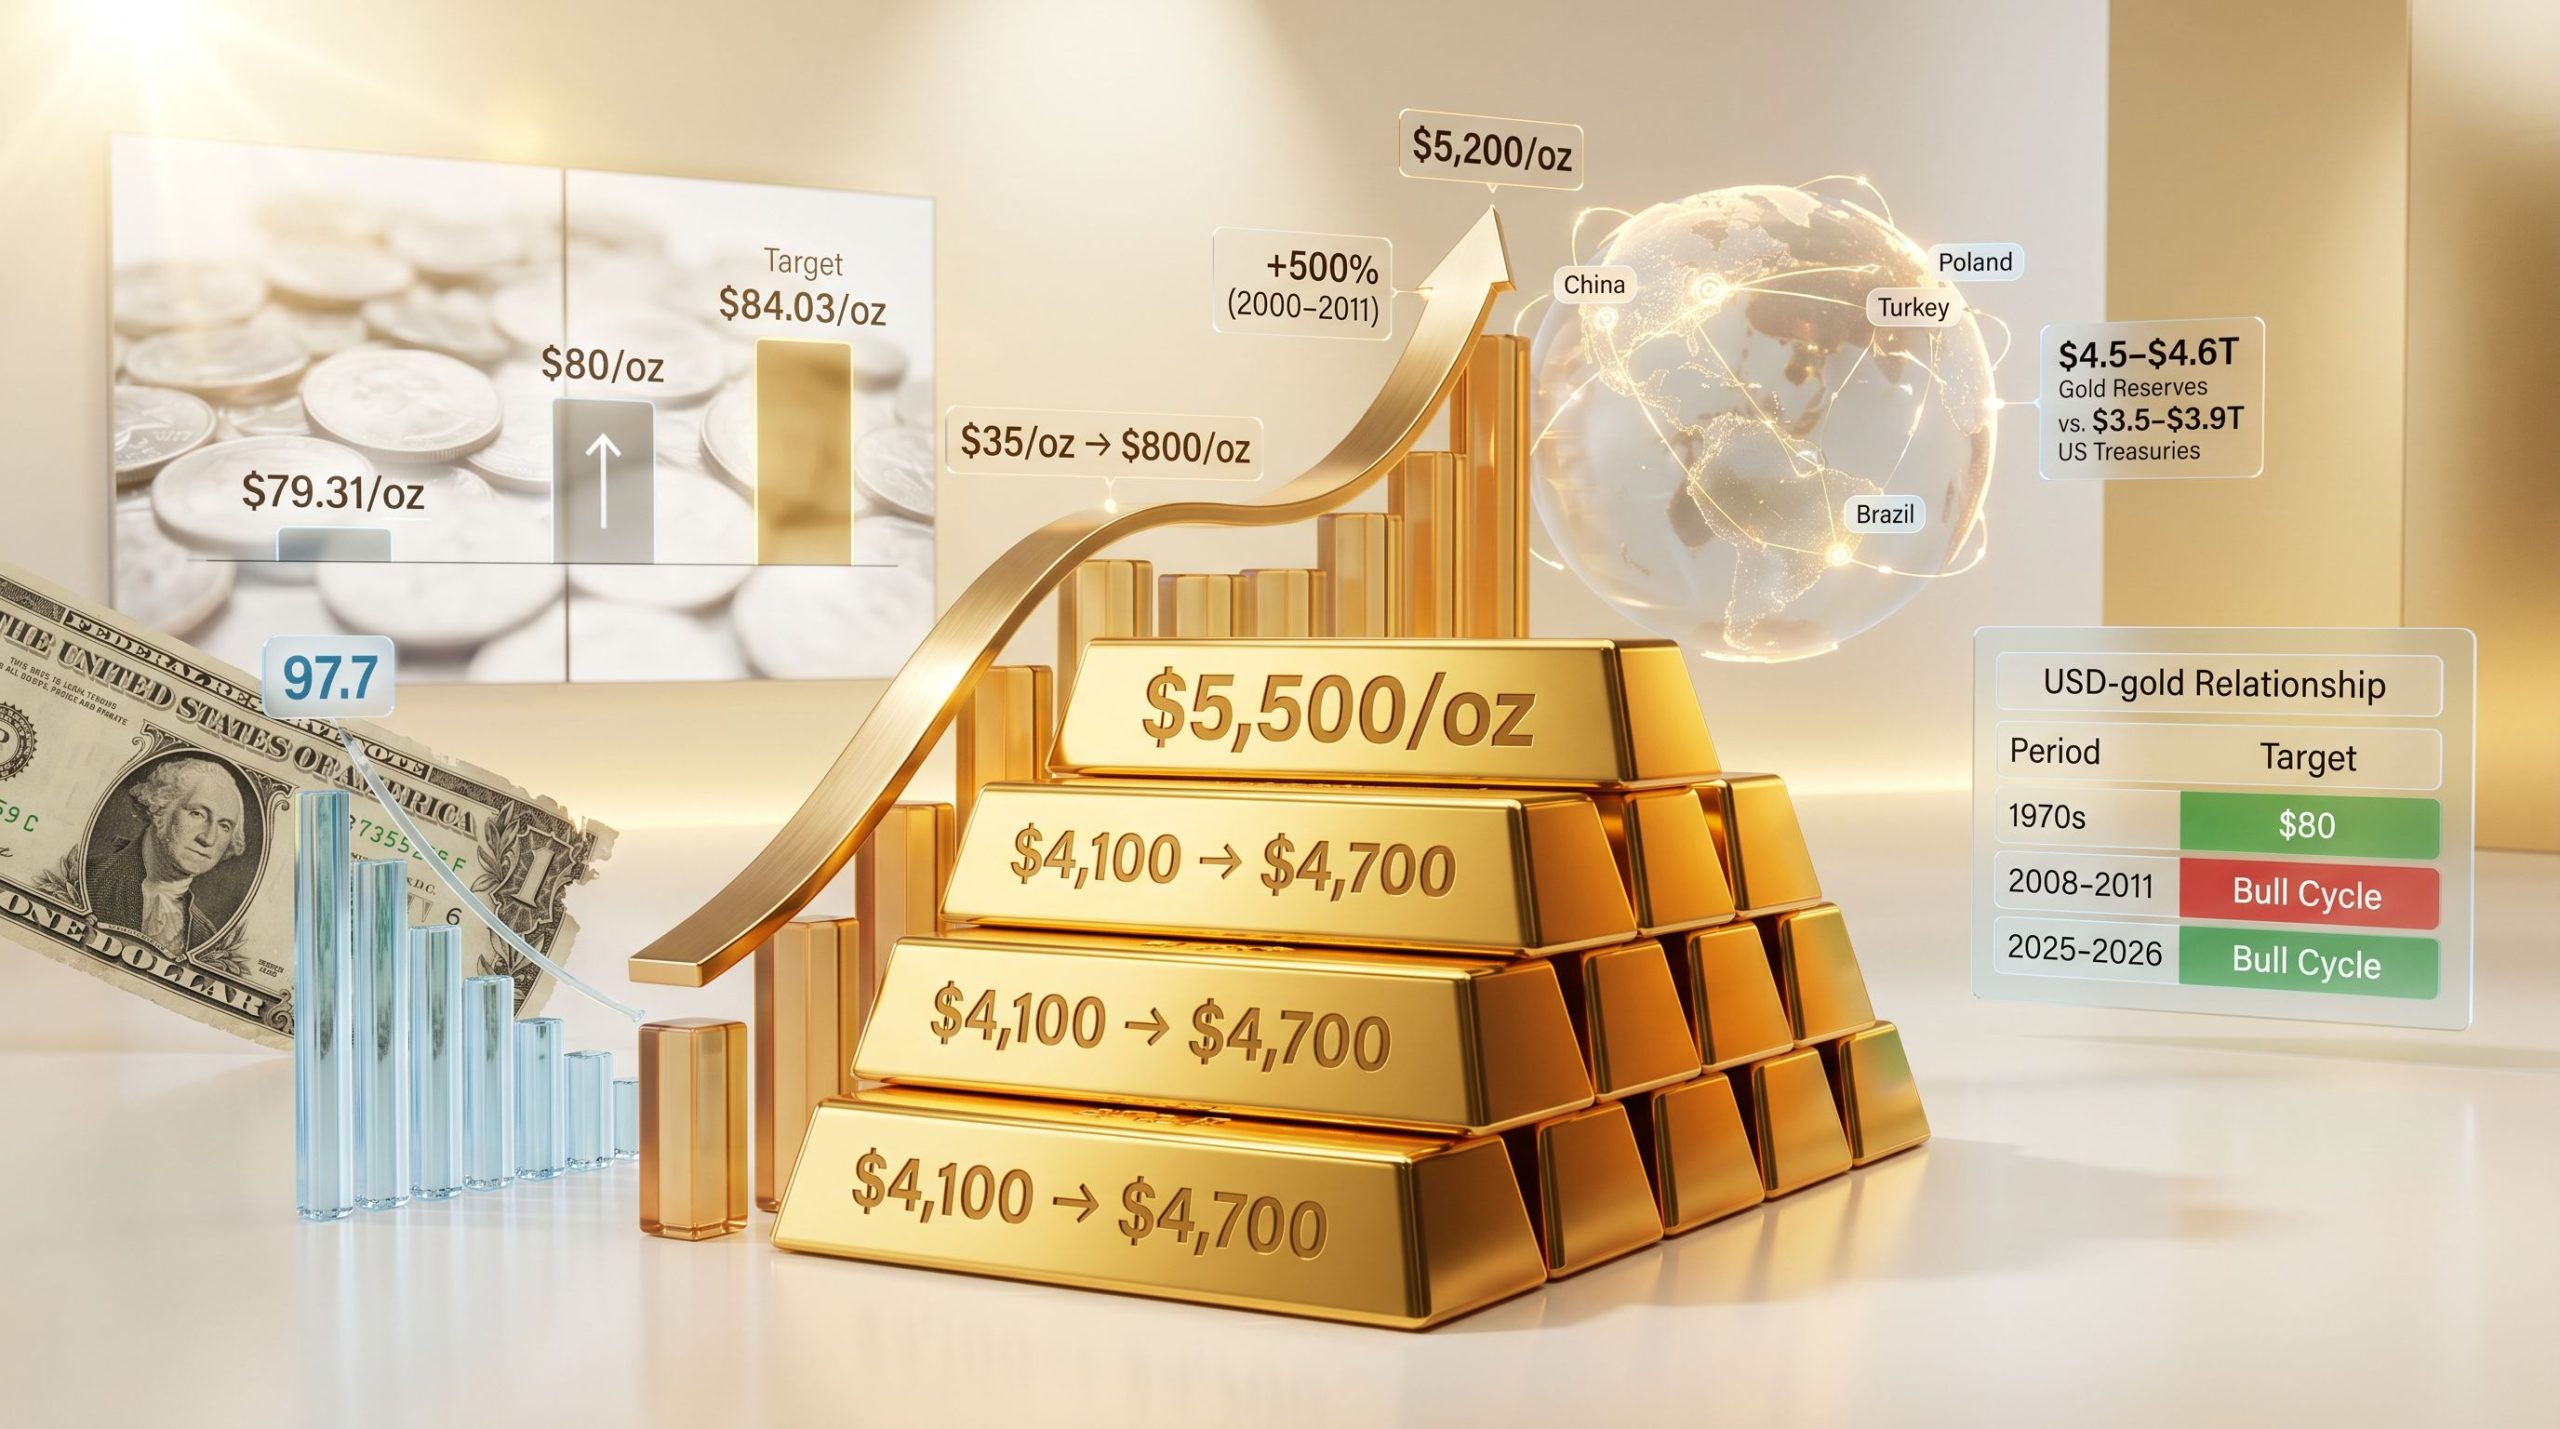
1. Central Bank Gold Buying & Accelerating De-Dollarization
A recent Discovery Alert report highlights that emerging market central banks increased their gold purchases in 2026. Data confirms buying activity in March from central banks in China and Türkiye. As global de-dollarization efforts continue, gold is emerging as a primary reserve asset. Some analysts suggest that if this trend persists, gold prices could break through the $6,000 mark.

2. Dollar Crisis and Real Interest Rates
According to Discovery Alert's analysis of dollar-gold market dynamics, rising fiscal deficits, falling real interest rates, and central bank buying are creating a strong link between a weaker dollar and higher gold prices. Structural analysis suggests that as fiscal pressure mounts, the safe-haven appeal of gold only intensifies.
3. Monetary Expansion and Structural Bull Cycle
The Discovery Alert Gold & Silver Market Outlook (May 5, 2026) reports that a combination of monetary expansion, central bank demand, and industrial supply shortages is driving a structural bull cycle for gold and silver. Silver, in particular, has recorded a strong year-over-year (YoY) gain of +141.74% due to rising industrial demand, further increasing the appeal of the precious metals sector.

This briefing is based on publicly available data and analytical reports; it does not constitute financial advice.
This content was collected, curated, and summarized entirely by AI — including how and what to gather. It may contain inaccuracies. Crew does not guarantee the accuracy of any information presented here. Always verify facts on your own before acting on them. Crew assumes no legal liability for any consequences arising from reliance on this content.
Powered by

