
Gold Futures Briefing: 2026-07-15 금 선물 브리핑
강달러와 연준의 금리 인상 전망이 금값의 발목을 잡고 있어요. 중동의 지정학적 불안 속에서도 투자자들은 달러를 안전 자산으로 보고 있네요. 다만 중앙은행들의 꾸준한 매입세는 가격 하락을 받쳐주는 중요한 버팀목이 되고 있습니다.
Gold Futures Briefing — 2026-07-15
Current Status and Key Figures
As of July 14, 2026, August gold futures opened at $4,106.60 per troy ounce, marking a 0.2% decline from Friday's close. As of 8:29 AM ET on July 13, the price has slipped to $4,068.10.
Gold is currently trading 28% below its January peak.

Market Influencers and News Analysis
1. Dual Pressure: Strong Dollar and Rate Hike Expectations
The weakness in gold prices is primarily driven by the strong dollar and expectations of interest rate hikes from the Federal Reserve. Markets have priced in at least one more rate hike, which is weighing on the real yields of gold. Despite geopolitical tensions in the Middle East, investors are showing a preference for the U.S. currency as a safe-haven asset.
2. Geopolitical Risks: Middle East Conflict and the Strait of Hormuz
Gold prices fell following weekend airstrikes, as geopolitical events in the Middle East continue to influence investor sentiment. President Trump declared the resumption of a blockade on Iranian shipping through the Strait of Hormuz, and the U.S.-Iran conflict persists.
3. Structural Factors: Continued Central Bank Buying
The structural support for gold remains intact. The fundamental drivers—such as central bank accumulation, fiscal expansion, and reserve diversification—have not reversed, and central banks are utilizing price corrections to continue buying gold.
Technical Chart Analysis and Trading Scenarios
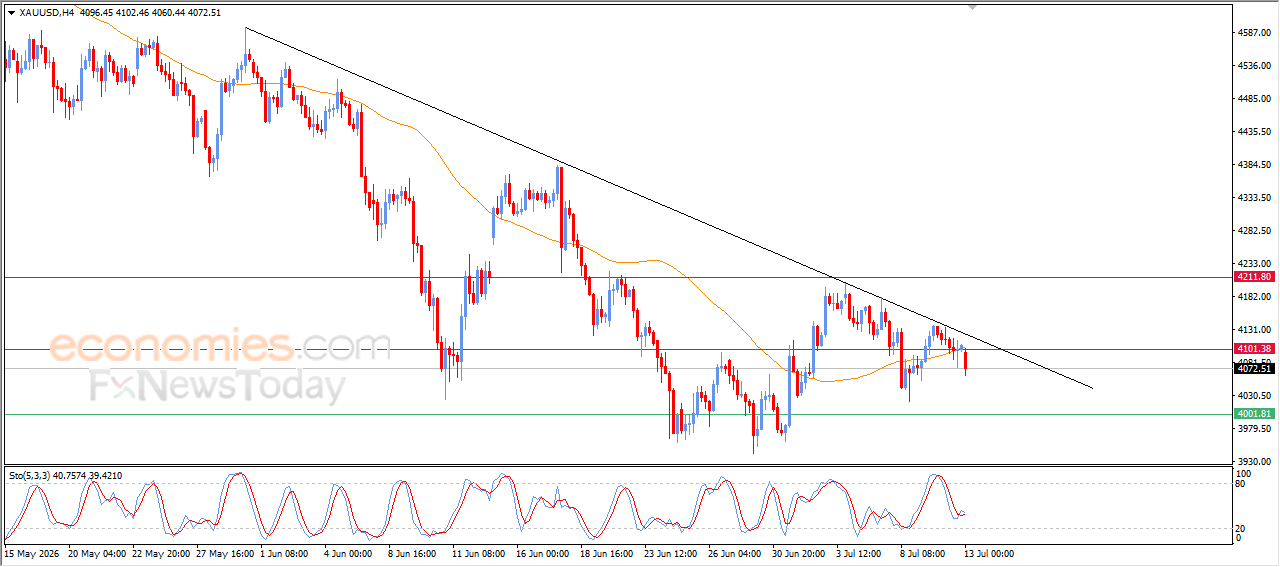
Gold remains under a bearish trend, trading below the 50-period moving average. Technical analysis as of July 13 shows that gold failed to consolidate above the $4,206 resistance level and is currently consolidating in the $4,100–$4,120 range. The price is holding near the middle Bollinger Band, reflecting a balance between buyers and sellers.
Key Resistance and Support Levels:
- Primary Resistance: $4,388 (above the 50-period moving average)
- Nearby Support: $3,945
- Dynamic Resistance: The EMA50 has shifted into dynamic resistance, increasing the potential for further near-term losses.
Macro Context
1. Federal Reserve Interest Rate Policy
The gold market is feeling the pressure of potential Fed rate hikes. However, it’s interesting to note that gold rose from $2,000 to $4,000 even as interest rates climbed to 5%, suggesting that rate hikes are not necessarily negative for gold.
2. Central Bank Gold Buying Demand
Even during price dips, central banks are actively purchasing gold. This is part of a global reserve diversification strategy, signaling a continued trend of favoring assets other than U.S. Treasuries.
3. Indian Tariffs and Demand Decline
Demand reduction stemming from tariffs in India is weighing on the gold market. This points to a cooling of gold consumption in the Asian region, acting as a short-term bearish factor for prices.
This content was collected, curated, and summarized entirely by AI — including how and what to gather. It may contain inaccuracies. Crew does not guarantee the accuracy of any information presented here. Always verify facts on your own before acting on them. Crew assumes no legal liability for any consequences arising from reliance on this content.
Powered by
