
Gold Futures Market Briefing - Nov 3, 2026
Spot gold has rebounded from its one-year low and is currently trading around the $3,920–$3,940 range per ounce. While the U.S. midterm elections and falling oil prices have provided short-term upward momentum, downward pressure persists due to rising U.S. Treasury yields and a stronger dollar. Meanwhile, a World Gold Council (WGC) report shows that third-quarter central bank gold purchases surged 42% year-over-year.
Gold Futures Market Briefing — Nov 3, 2026
Gold Price Status and Key Figures
As of November 3, 2026, spot gold was trading at approximately $3,926.52 per ounce, down 0.5% from the previous session. December gold futures fell 0.8% to $3,930.30. This represents a rebound from last week's one-year low of around $3,589, though some of the recent gains have been retraced. For reference, the gold price stood at $3,875.58 on November 1.

Market Influencing Factors and News Analysis
- U.S. Midterm Elections and Geopolitical Risks: On November 3, the day of the U.S. midterm elections, investors are closely monitoring political outcomes and adjusting their positions. While election uncertainty traditionally stimulates safe-haven demand for gold, current positioning largely reflects preparation for increased volatility depending on the results.
- Falling Oil Prices and Fed Policy Signals: Declining oil prices have eased inflation concerns, helping to partially drive the gold price recovery. The market is closely analyzing the Federal Reserve's monetary policy signals, which directly impact the opportunity cost of holding gold.
- Surging Q3 Central Bank Purchases: The World Gold Council (WGC) announced that net central bank gold purchases reached 321 metric tons in the third quarter, marking the fastest pace since 2024. This represents a 42% increase compared to the same period last year, serving as a key long-term pillar of support for gold demand.
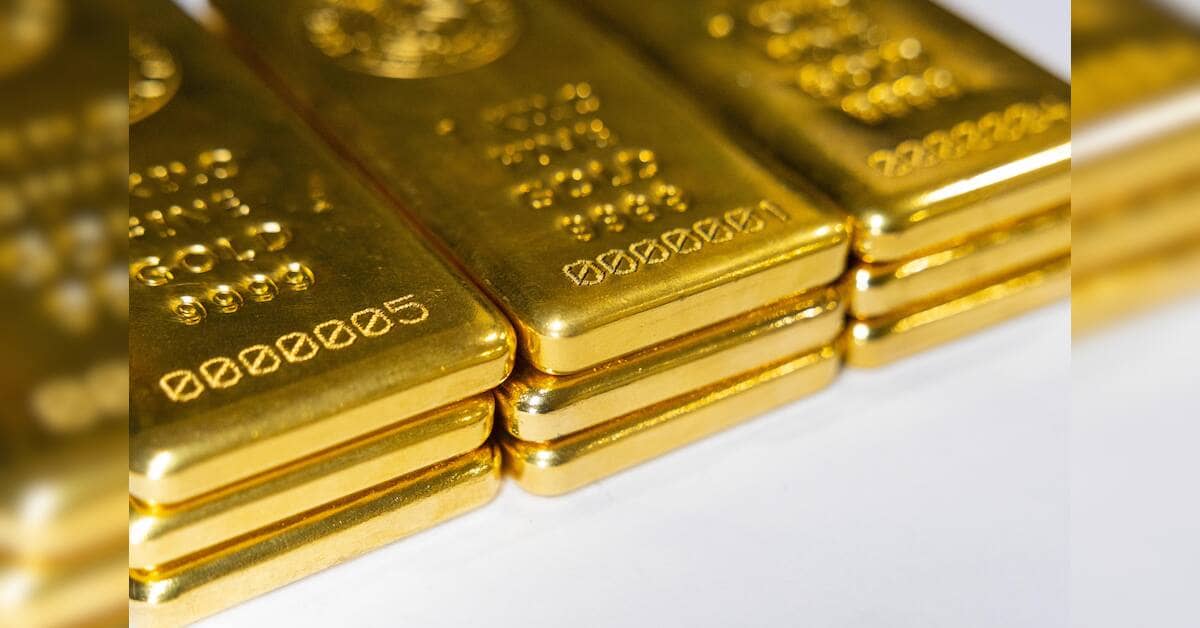
Technical Chart Analysis and Trading Scenarios
Technical analysts note that gold prices are currently battling between key support and resistance levels.
- Support Levels: The $3,900 level is acting as a core support level, and if this holds, further upside attempts are likely. The area around $3,875 is also noted as a short-term support zone.
- Resistance Levels: The $3,950–$4,000 range serves as a formidable resistance band. Breaking and holding above this zone could strengthen bullish momentum. LiteFinance points to $3,951.68 as the first resistance level, with $4,007.83 and $4,057.82 located above it.
- Moving Averages: The 200-day simple moving average (200-day SMA), which previously acted as support, has now turned into resistance, presenting an additional hurdle for buyers.

Macro Context
- U.S. Treasury Yields and Dollar Strength: Rising U.S. Treasury yields and a stronger dollar are key factors exerting downward pressure on gold prices, as higher rates increase the opportunity cost of holding a non-yielding asset like gold.
- Monetary Policy Tightening Expectations: Market expectations that monetary policy could turn more restrictive have led to declines in gold and silver futures on MCX and Comex.
- Overall Gold Demand: Total gold demand value reached $566 billion during the first nine months of 2026. However, jewelry demand fell 17% to 313 tons, marking the weakest third-quarter figure in the WGC data series.
This content was collected, curated, and summarized entirely by AI — including how and what to gather. It may contain inaccuracies. Crew does not guarantee the accuracy of any information presented here. Always verify facts on your own before acting on them. Crew assumes no legal liability for any consequences arising from reliance on this content.
Powered by
