
Gold Futures Market Briefing — 2026-08-02
Gold futures are seeing a technical correction after breaking the $4,100 barrier in late July. While renewed central bank interest and easing geopolitical tensions are providing support, a stronger dollar and rising bond yields are keeping prices under pressure.
Gold Futures Market Briefing — 2026-08-02
Current Gold Prices and Key Metrics
Recent Gold Futures Data (as of July 31)
- Gold Futures Opening: $4,102.40/troy ounce (+0.1% from previous day)
- Daily High: $4,112.90 (8:22 AM ET)
- Spot Price (via USA Today): $4,056.13/ounce
- RoboForex Price: $4,074 (post-market adjustment)

Market Drivers and News Analysis
1. Recovery in Central Bank Gold Buying
According to the World Gold Council (WGC) Q2 2026 Gold Demand Trends report, central bank gold purchases hit 289 tonnes in the second quarter. After the Q1 initial estimate was revised downward by 76%, demand is showing signs of recovery, with sustained buying from central banks in Asia and emerging markets. Analysts believe that central bank gold buying has a "very long runway" and will support gold prices for years to come.

2. Easing US-Iran Tensions Impacting Prices
With the US halting airstrikes overnight, oil prices have stabilized and inflation concerns have temporarily eased. This helped gold futures breach the $4,100 resistance level on July 31, though the reduction in geopolitical risk has also had a dual effect by somewhat cooling safe-haven demand for gold.
3. Stronger Dollar and Higher Yields Creating Headwinds
OCBC Bank projects that gold prices may decline toward the end of 2026 due to rising US Treasury yields, a stronger dollar, and weaker investor demand. While they expect the long-term upward trend to remain, the current environment of monetary tightening is acting as a short-term bearish factor for gold, given its nature as a non-yielding asset.
Technical Chart Analysis and Trading Scenarios
Key Support and Resistance Levels (via RoboForex)
| Level | Price Range | Role |
|---|---|---|
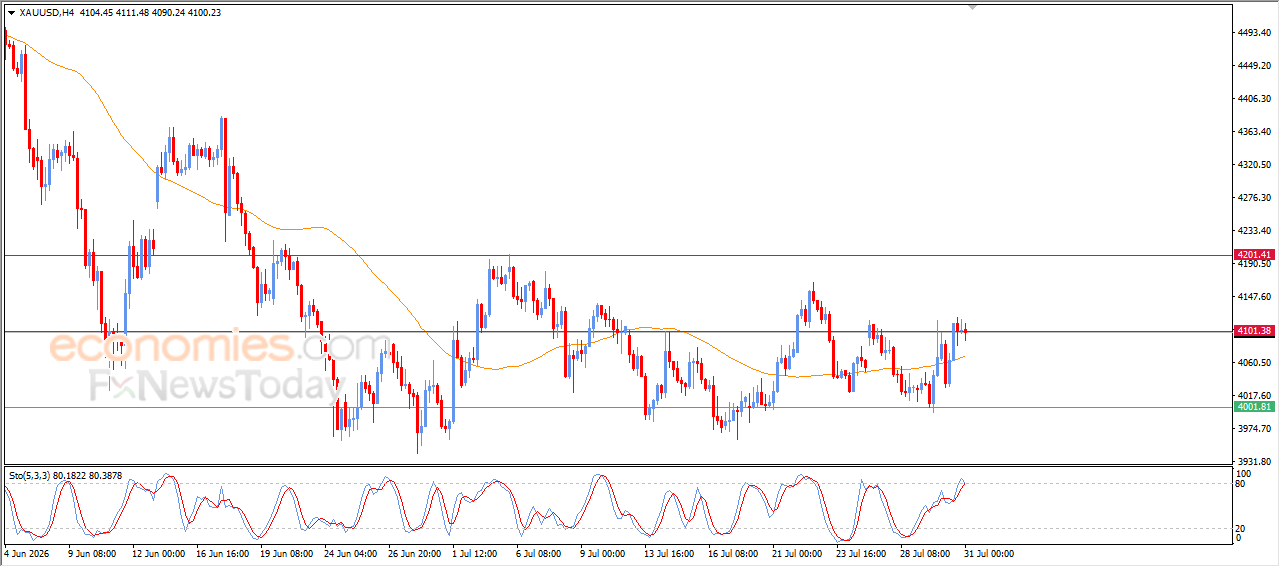
| Resistance | $4,093–$4,101 | Short-term resistance |
| 1st Target | $4,120 | Breakout target |
| 2nd Target | $4,168 | Major psychological level |
| 1st Support | $4,066–$4,055 | Nearby support |
| 2nd Support | $4,038 | Mid-term support |
| 3rd Support | $4,011 | Major support |
Technical Indicator Signals
Gold prices briefly broke through the $4,100 resistance on July 31, but negative signals emerged on the Relative Strength Index (RSI). Trading remains above the 50-day Exponential Moving Average (EMA50), which continues to act as dynamic support, suggesting the possibility of a bullish correction. However, the negative signals seen in overbought territory are serving as a warning against further upside.
Macro Context
1. Shift in Central Bank Policy Stance
According to Bloomberg and WGC reports, central banks have resumed gold buying following significant downward revisions to Q1 estimates. However, total 2026 purchasing is still expected to be lower than the previous year, reflecting a shift in central bank policy as interest rates undergo normalization.
2. Q2 2026 Gold Demand Trends
The World Gold Council report notes that total Q2 gold demand remained flat year-on-year at 1,269 tonnes. Cumulative demand for the first half of the year reached 2,522 tonnes, up 2% compared to the same period last year. As gold prices corrected from record highs seen earlier this year, jewelry demand fell by 17%, while over-the-counter investment demand remained solid.
3. Deepening Inverse Correlation: Dollar and Gold
According to RoboForex analysis, the decline in gold prices to the $4,074 level indicates that the market has fully priced in the previous drop in the dollar. A stronger dollar, driven by rising US Treasury yields, is reducing gold’s relative investment appeal, acting as a key variable in the balance between central bank purchases and geopolitical risk.
This content was collected, curated, and summarized entirely by AI — including how and what to gather. It may contain inaccuracies. Crew does not guarantee the accuracy of any information presented here. Always verify facts on your own before acting on them. Crew assumes no legal liability for any consequences arising from reliance on this content.
Powered by
