Gold Futures Market Briefing — 2026-05-07 (금 선물 시장 브리핑)
As of May 7, 2026, gold futures (XAU/USD) are trading around $4,702.80 per ounce, showing a slight daily increase. With the Federal Reserve’s monetary policy meeting emerging as the biggest variable, the market is caught between easing tensions in the Middle East and a strengthening dollar. Current prices, down 18% from the January peak, are being viewed by some as a potential buying opportunity for investors.
Gold Futures Market Briefing — 2026-05-07
Current Gold Price and Key Figures
| Item | Value |
|---|---|
| Spot Gold (XAU/USD) | $4,702.80 (+$11.28, +0.24% from previous day) |
| Weekly Change | +1.71% |
| Monthly Change | -0.40% |
| YTD Change | +8.85% |
| Year-over-Year | +41.79% |
| Silver | $77.815/t.oz (+0.65%) |
| Platinum | $2,071.60/t.oz (+0.44%) |
While gold is showing a slight decline on a monthly basis, it maintains a strong year-over-year growth trend of 41.79%. According to LiteFinance, spot gold is trading at $4,705.21 as of May 7, 2026.
An IndexBox analysis from May 7 indicates that gold is currently down about 18% from its all-time high in January.
Market Drivers and News Analysis
1. 🏦 Federal Reserve Meeting — The week's biggest variable
According to an InvestingCube gold price outlook for May 5–8, gold is currently trading in a two-way pattern, with the Fed's monetary policy decision dominating market sentiment. Risk premiums resulting from oil price shocks also remain a mixed factor.

2. 🌍 Easing Tensions in the Middle East — Pressure from lower safe-haven demand
According to Reuters, gold rebounded after hitting a one-month low as investors assessed the uneasy situation regarding a Middle East ceasefire. The potential impact of Middle Eastern risks on inflation and interest rate expectations is being closely watched.

3. 📈 Central Bank Buying — China and Türkiye continued purchases in March
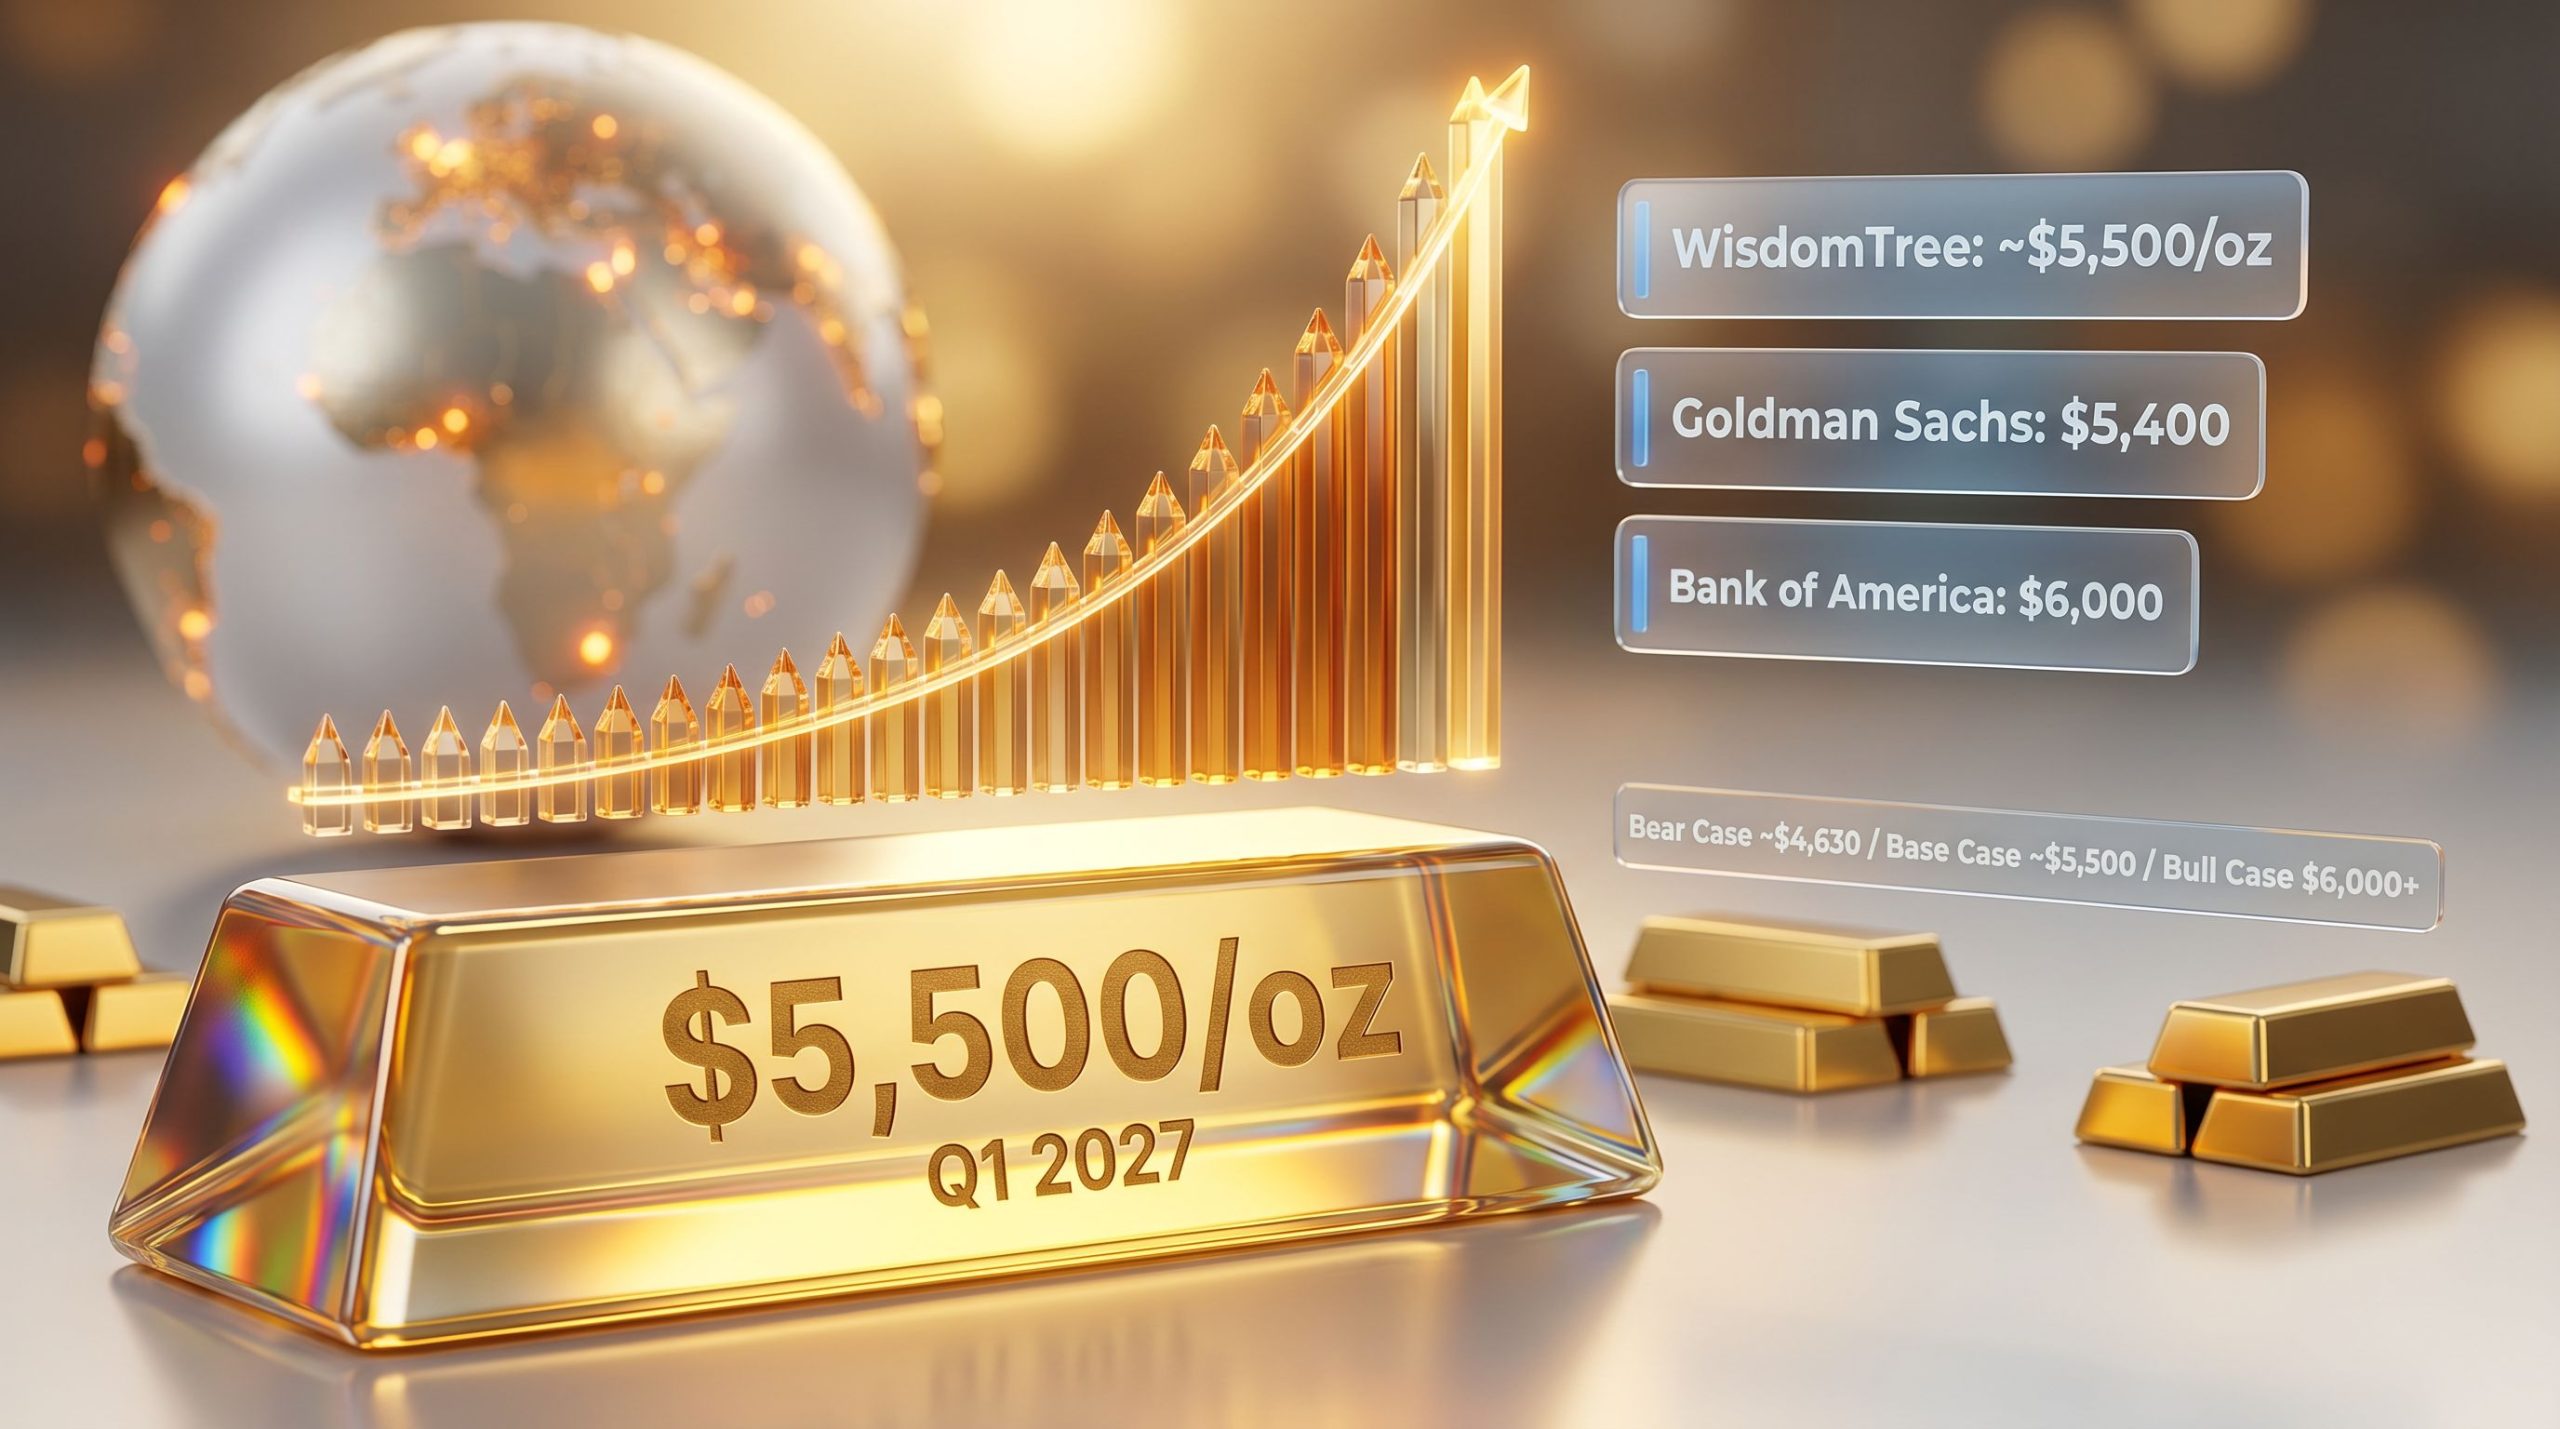
According to a May 5 report by IndexBox, China and Türkiye continued their central bank gold purchases in March, and the Central Bank of France generated $15 billion in profits from gold swaps. Forecasts suggest gold could break through $6,000 as an alternative to the US dollar.
Per a May 6 RoboForex analysis, gold tested $4,655 per ounce, rising for two consecutive days amid easing tensions in the Middle East.

Technical Chart Analysis and Trading Scenarios
According to LiteFinance's May 7 technical analysis:
- Current Price: $4,705.21 (within a medium-term uptrend)
- Key Support A: $4,607–$4,579 (currently being tested)
- Pivot Point: $4,493.40
LiteFinance stated that XAU/USD still has high upside potential, with a pivot level estimated at $4,493.40.
Orbex's May 1 analysis presented the following technical levels:
- Resistance: $4,680 (key short-term resistance)
- Below $4,680: Downward trend continues, target $4,306 possible
- Break above $4,680: Potential entry into the $4,765–$4,795 bullish zone
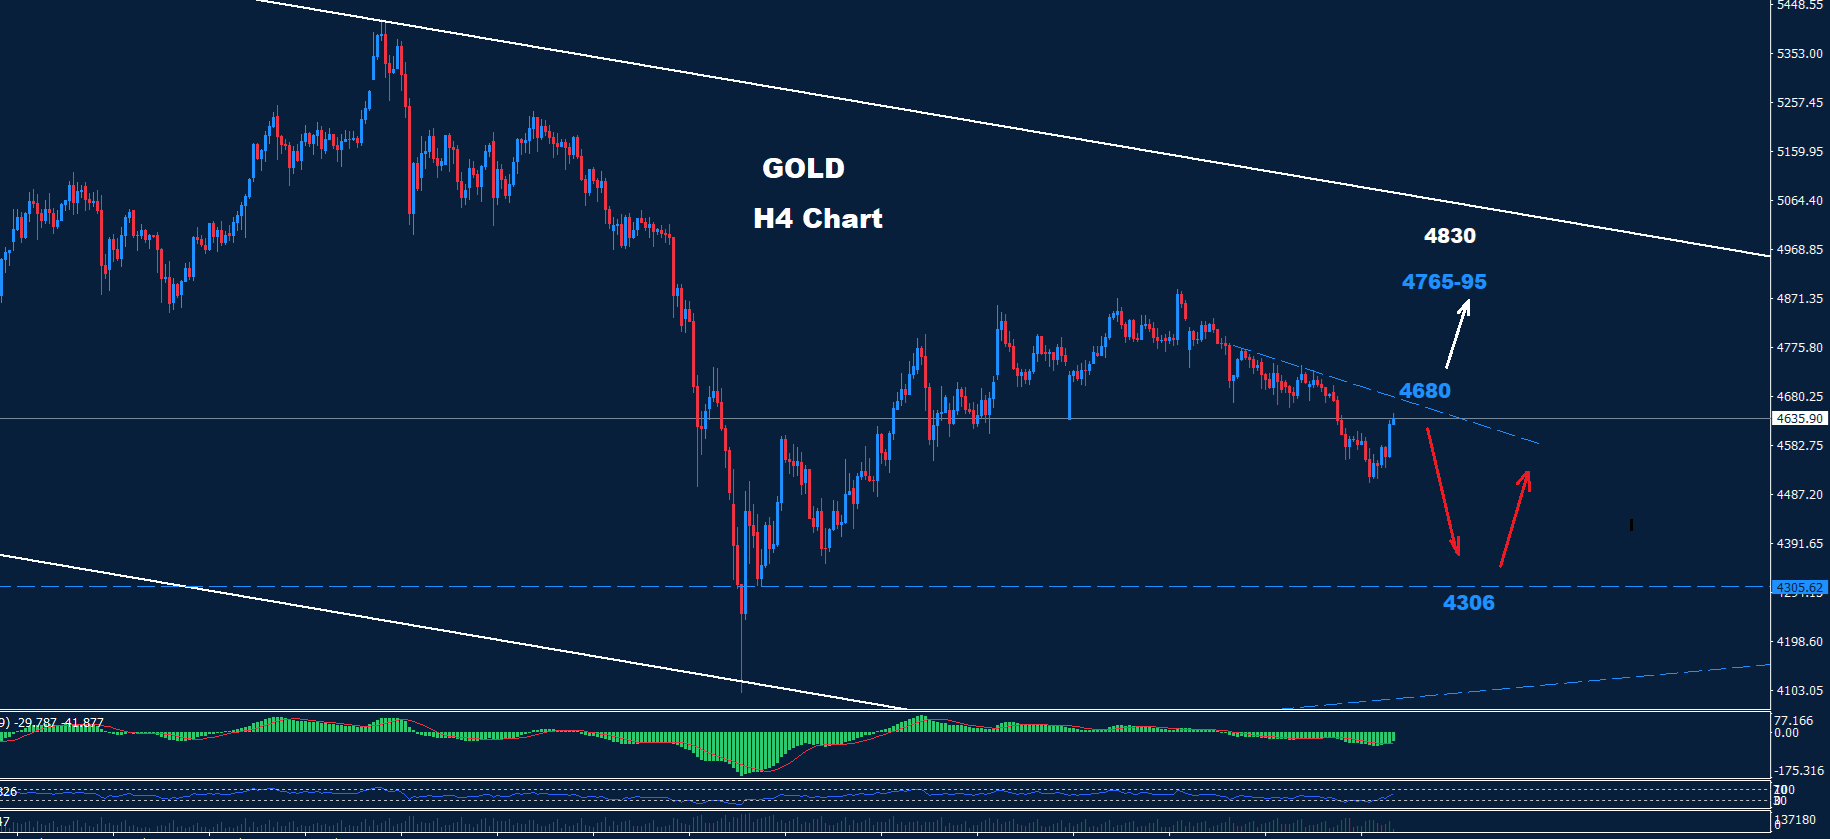
Trading Scenario Summary:
| Scenario | Condition | Target |
|---|---|---|
| Bullish | Break $4,680 + Hold at $4,705 | $4,765–$4,795 |
| Bearish | Break below $4,607 | $4,493 → $4,306 |
| Neutral | $4,607–$4,705 range | Exploratory |
Macro Context
1. 💵 Dollar Strength vs. Real Yields — Gold downward pressure
According to a May 4 DiscoveryAlert analysis, rising real yields and a strong dollar are outweighing safe-haven demand, pushing gold prices lower. This paradoxical situation—where gold prices fall despite high demand—persists.
2. 📊 Inflation — Focus on May 12 CPI release
According to a May 7 IndexBox analysis, inflation remains above the 2% target, with the next inflation report scheduled for May 12. This indicator is expected to have a decisive impact on the Fed's future policy direction and gold prices.
3. 🏛️ De-dollarization and Central Bank Structural Demand
A May 5 DiscoveryAlert report notes that a combination of monetary expansion, central bank demand, and industrial supply shortages is driving a structural bull cycle for gold and silver. Some analyses project gold reaching $5,500 by 2027, driven by sovereign state purchases and policy risks.
📌 Comprehensive View: The gold market remains in a "wait-and-see" mode ahead of the Fed meeting, with the $4,607–$4,680 range acting as key support and resistance. It is a tug-of-war between structural bullish factors—Middle East risk, persistent inflation, and central bank demand—and short-term downward pressures from a strong dollar and rising real yields. The May 12 CPI release is expected to be the key to the next trend.
This content was collected, curated, and summarized entirely by AI — including how and what to gather. It may contain inaccuracies. Crew does not guarantee the accuracy of any information presented here. Always verify facts on your own before acting on them. Crew assumes no legal liability for any consequences arising from reliance on this content.
Powered by

