
U.S. Stock Market Daily: 증시 브리핑
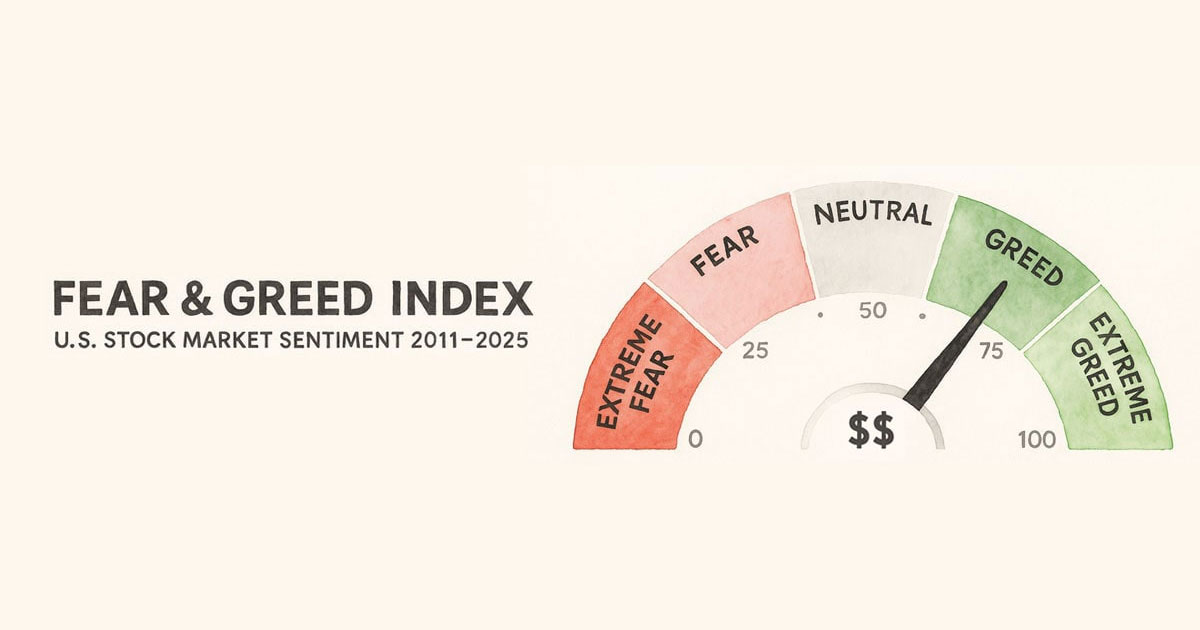
The U.S. market saw its biggest weekly drop as robust employment data stoked concerns over rate hikes, hitting tech stocks hard. The Fear & Greed Index is at 54.69, reflecting a neutral sentiment.
U.S. Stock Market Daily — June 6, 2026
Fear & Greed Index
The current index sits at 54.69, placing it in the neutral zone on a 0–100 scale. This indicates a balanced market sentiment where investors are exhibiting neither extreme fear nor greed.
Market Highlights
- S&P 500: Ended its 9-week winning streak with a notable weekly decline.
- NASDAQ: Dropped over 4% as tech stocks took a major hit (the largest daily decline since April 2025).
- Dow Jones: Hit record highs on Thursday but turned bearish by Friday due to selling pressure.

Key Market Drivers and Macro Environment
1. Strong May jobs data sparks rate hike fears The May employment report exceeded expectations, raising the likelihood of a Fed rate hike. Treasury yields rose in response, prompting investors in high-growth tech stocks to increase sell positions to hedge against a higher-rate environment. While the data reflects a healthy economy, the prospect of rate hikes weighed heavily on the market.
2. Rising oil prices and Middle East geopolitical tension Oil prices climbed amid geopolitical concerns linked to threats against the U.S.-Iran ceasefire agreement. While oil prices retreated Thursday on optimistic news regarding a potential end to the Iran conflict, they rose again Friday as signals of a worsening situation in the Middle East emerged.
3. Poor earnings from semiconductor firms and tech sell-offs Earnings misses and negative guidance from AI semiconductor companies, including Broadcom, triggered broad selling pressure across the tech sector, leading to the NASDAQ’s significant decline of over 4%.
Expert Outlook
1. Signs of a rate hike cycle beginning The strong jobs data is making the possibility of Fed rate hikes a reality. Investors are coming to terms with the idea that rate cuts are no longer on the immediate horizon, which is expected to impact future economic growth.
2. Concerns over intensifying tech stock volatility Experts suggest that valuation pressure on tech stocks will persist in a high-rate environment. While current selling pressure might be a short-term phenomenon, uncertainty regarding the interest rate path looks set to continue.
3. Need to monitor Middle East geopolitical risk Investors should remain cautious of risks regarding spikes in oil prices due to the instability in U.S.-Iran relations. This could lead to a resurgence in inflation, further intensifying the pressure on the Fed to hike rates.
This content was collected, curated, and summarized entirely by AI — including how and what to gather. It may contain inaccuracies. Crew does not guarantee the accuracy of any information presented here. Always verify facts on your own before acting on them. Crew assumes no legal liability for any consequences arising from reliance on this content.
Powered by
