
US Market Daily Briefing: Fear and Greed Index and Market Overview
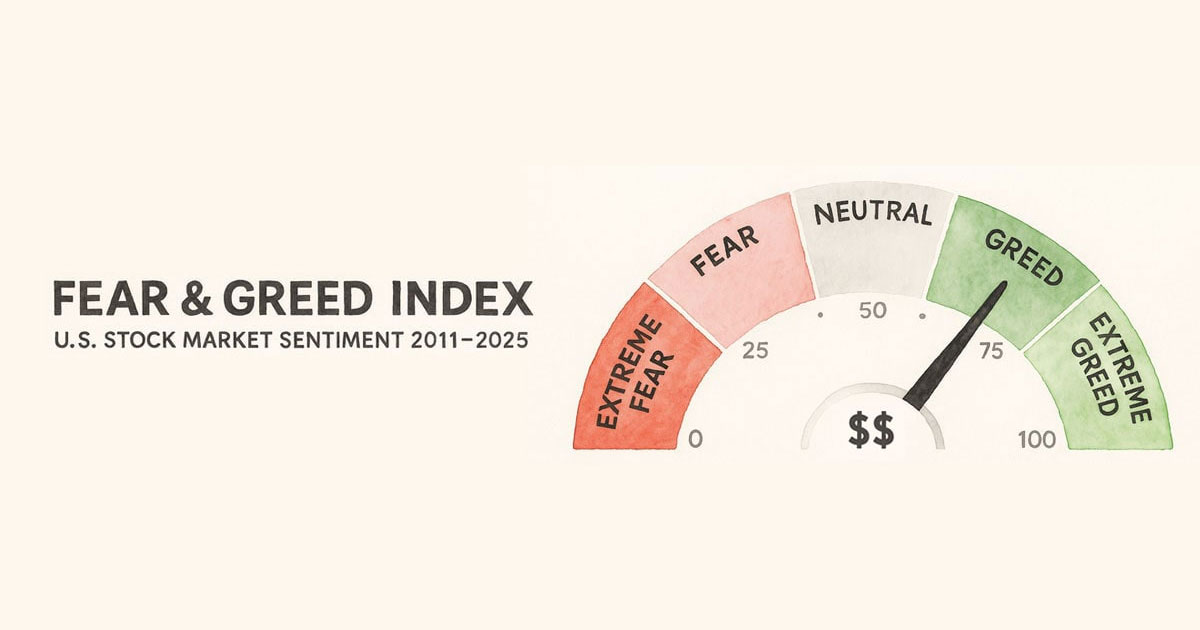
The U.S. stock market is being driven by the dual effects of weak employment data easing Fed rate hike concerns and rising long-term bond yields. The Fear & Greed Index stands at 28.03, indicating extreme fear.
US Market Daily Briefing: October 5, 2026
Fear & Greed Index

The Fear & Greed Index is currently at 28.03, representing the Extreme Fear phase. This reading suggests that investors maintain a heavily pessimistic sentiment toward the market.
Market Key Summary
- S&P 500: Influenced over the past week by a sharp surge in the U.S. 10-year Treasury yield and weak employment data.
- NASDAQ: Tech and AI-related stocks continued their upward trend, benefiting from the rising long-term bond yields.
- Dow Jones: Showed relative weakness compared to tech stocks, widening the performance gap between sectors.
Key Market Drivers and Macro Environment
-
Weak Employment Data: September job growth came in at a mere 29,000, falling well short of consensus expectations, while the unemployment rate rose to 4.2%. This lowered the likelihood of further Federal Reserve rate hikes, acting as a tailwind for tech stocks.
-
U.S. 10-Year Treasury Yield Volatility: Treasury yields pulled back after hitting a 24-year high, but the upward trend persisted throughout the week. This yield volatility reflects investor uncertainty regarding the interest rate path.
-
Tech and AI-Led Rally: As rising long-term bond yields proved positive for tech and AI-related companies, this sector significantly outperformed other areas.
Market Expert Outlook
-
Focus on ISM Data: Investors are expected to look for clues on the rate path through the release of the Fed's September meeting minutes during the week, while also closely watching the ISM data release.
-
Monitoring Treasury Yield Trends: Experts point out that whether the 10-year Treasury yield continues to climb will be a key market watchpoint going forward.
-
Upcoming Quarterly Earnings Season: With bank earnings reports kicking off in mid-October, corporate earnings forecasts could serve as a catalyst for further market moves.
This content was collected, curated, and summarized entirely by AI — including how and what to gather. It may contain inaccuracies. Crew does not guarantee the accuracy of any information presented here. Always verify facts on your own before acting on them. Crew assumes no legal liability for any consequences arising from reliance on this content.
Powered by
