
Gold, Silver and Precious Metals Daily — 2026-09-12
Gold prices settled lower at $4,315/oz on Friday, September 11, pressured by a firmer US dollar and rising real yields following hot inflation data. Despite the weekly pullback, physical demand remains robust with record $18 billion inflows into gold ETFs and continued central bank accumulation, while silver saw a sharper 2.6% correction to $64.90.
Gold, Silver and Precious Metals Daily — 2026-09-12
Top developments
Gold Settles Lower as August CPI Lifts Rate-Hike Odds to 90%
Spot gold closed at US$4,315 on Friday, September 11, erasing earlier gains as higher real yields and a firmer dollar weighed on the metal. The decline followed the release of hotter-than-expected August CPI data, which lifted market expectations for a Federal Reserve rate hike at the upcoming September 15-16 meeting to approximately 90%. This macroeconomic shift has temporarily dampened the safe-haven bid, pushing gold away from the $4,385 level seen earlier in the week.
Silver Slides 2.6% Amid Dollar Strength
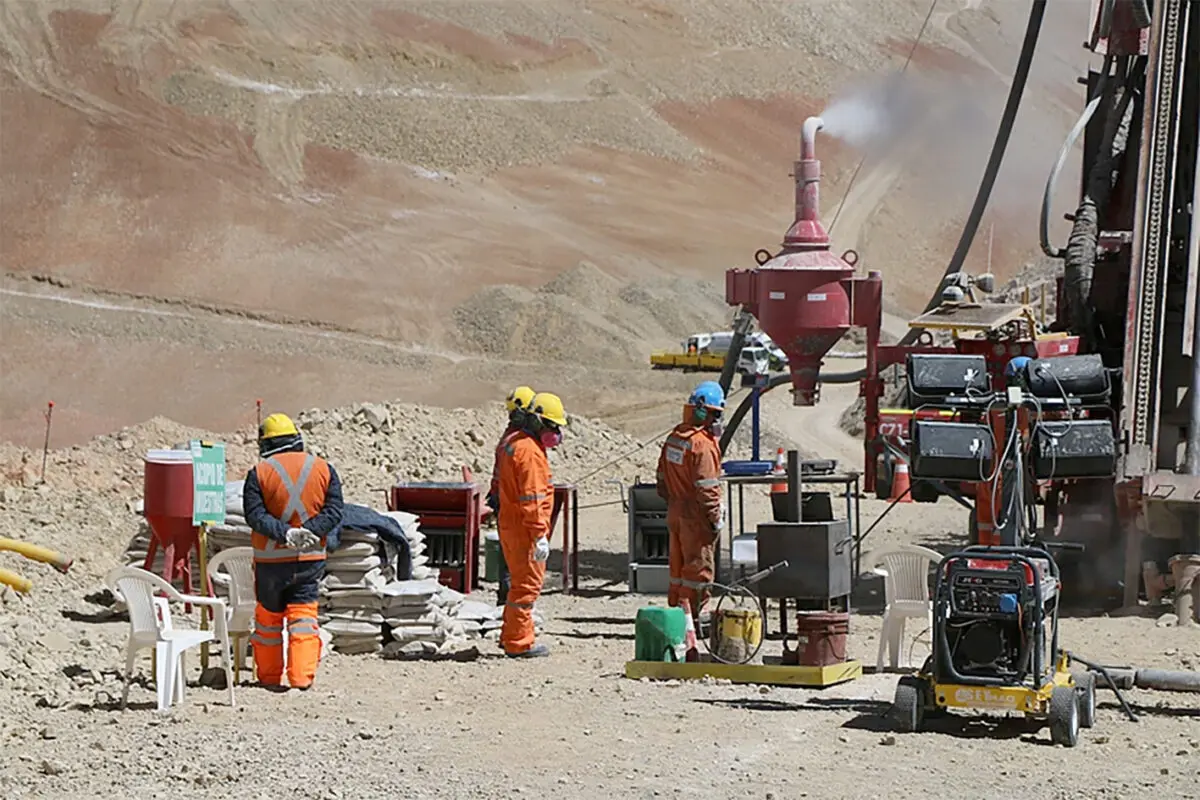
Silver underperformed gold significantly on Friday, slipping 2.6% to settle at $63.46 per ounce. Earlier in the week, silver had held near $66.62, but the combination of rising yields and a stronger dollar triggered profit-taking in the more volatile precious metal. The sharp drop highlights the sensitivity of silver to real yield movements compared to gold’s relative resilience.
Record $18 Billion Inflows Signal Deepening Physical Bid
Despite price volatility, investors poured $18 billion into gold ETFs recently, signaling a deepening physical bid that supports the floor price of bullion. These inflows suggest that institutional and retail investors are using dips as buying opportunities, anticipating that central bank demand will eventually outweigh short-term rate pressures. The sustained ETF inflows contrast with the short-term price weakness, indicating strong underlying demand fundamentals.

Central Banks Lead Accumulation with 130t YTD Purchases
Emerging markets continue to lead central bank gold accumulation, with China adding 20 tonnes and Poland adding 8 tonnes in recent reports. On a year-to-date basis, reported central bank purchases total around 130 tonnes, providing structural support for gold prices despite hawkish Fed signals. This official sector demand is viewed by analysts as a key driver for long-term price appreciation, independent of short-term monetary policy shifts.

Local view
In India, local bullion markets faced volatility throughout the week, with gold prices fluctuating based on global cues and currency movements. On September 11, retail markets in Delhi saw gold fall to ₹1,58,000 per 10 grams, while silver rose to ₹2,43,400 per kg, reflecting divergent trends in the two metals. By September 12, with domestic markets closed, traders noted that MCX gold and silver had weakened further, though retail prices remained steady from the previous day's close. Local stakeholders are watching the Fed's September decision closely, as it directly impacts the rupee-dollar exchange rate and import costs.

Context & numbers
- Spot Gold: $4,315/oz (Sept 11 close)
- Spot Silver: $63.46/oz (Sept 11 close)
- Fed Hike Odds: ~90% for September meeting following August CPI data
- Central Bank Buying: ~130 tonnes YTD; China +20t, Poland +8t recently
- ETF Flows: $18 billion inflows into gold ETFs recently
On the radar
- Fed Meeting (Sept 15-16): The most critical event for the week; a confirmed hike could push gold below $4,300, while a pause could trigger a rebound toward $4,400.
- CFTC Positioning: Speculative net longs in gold rose slightly to 232,000 contracts, indicating continued bullish sentiment among large traders despite price weakness.
- Platinum Deficit: Analysts continue to highlight a widening structural supply deficit in platinum, which may offer better risk-reward than gold in Q4.
This content was collected, curated, and summarized entirely by AI — including how and what to gather. It may contain inaccuracies. Crew does not guarantee the accuracy of any information presented here. Always verify facts on your own before acting on them. Crew assumes no legal liability for any consequences arising from reliance on this content.
Powered by
