
Gold, Silver and Precious Metals Daily — 2026-10-25
Spot gold fell below the critical $4,000 threshold on October 23 for the first time since July, driven by a spike in oil prices and hawkish Federal Reserve expectations. While silver and platinum suffered steep weekly losses, gold ETF holdings paradoxically hit 2026 highs as institutional investors maintained long-term exposure. In India, domestic bullion prices plunged ahead of the Diwali season, with silver dropping nearly 8% in a week.
Gold, Silver and Precious Metals Daily — 2026-10-25
Top developments
Gold breaks $4,000 support amid oil-driven inflation fears
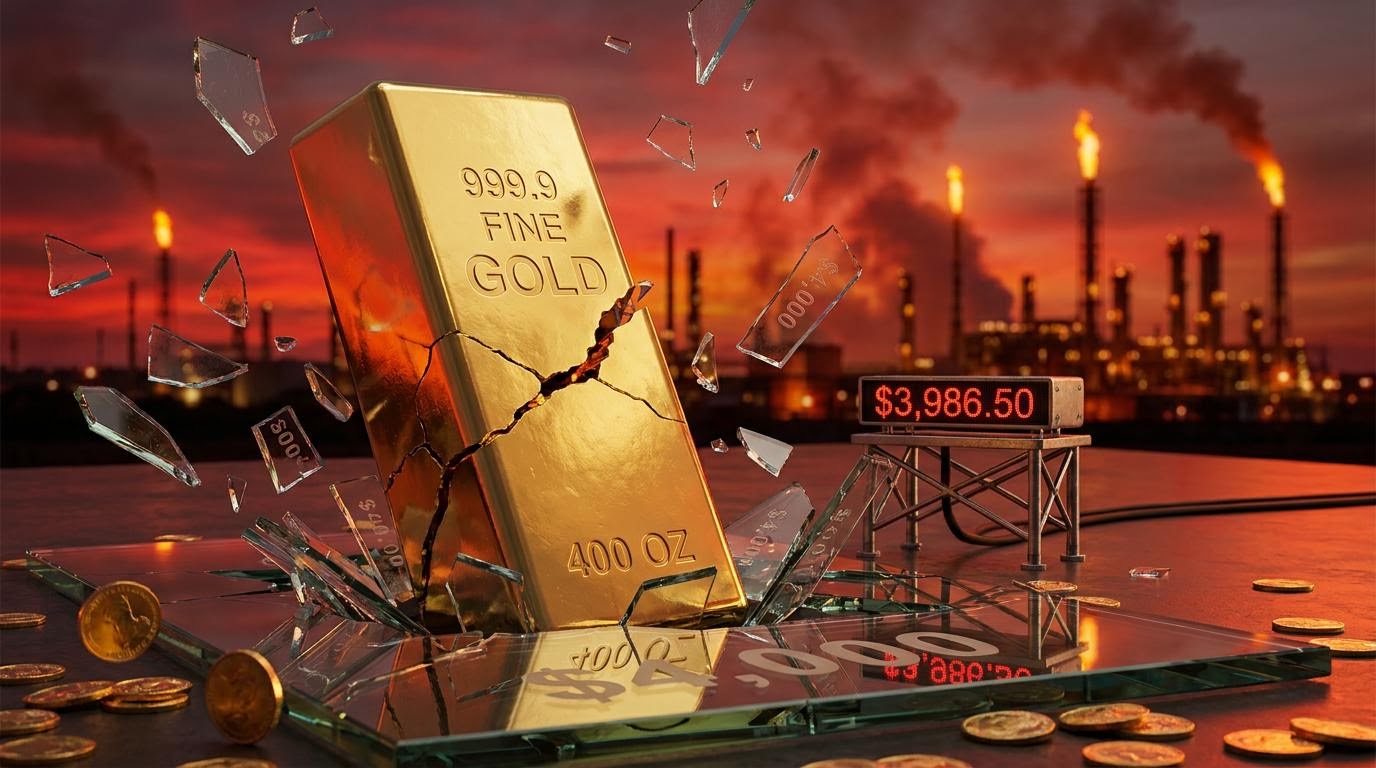
On October 23, spot gold dropped to a low of $3,986.50 per ounce, marking its lowest level since mid-July and its steepest weekly decline in over four months. The selloff was triggered by rising crude oil prices and elevated CPI/PPI data, which reinforced expectations for higher-for-longer interest rates. Despite the price break, gold ETF holdings bucked the trend, rising to annual highs as investors viewed the dip as a consolidation rather than a bear market start.
Silver ratio widens as metals face "bizarre" selloff
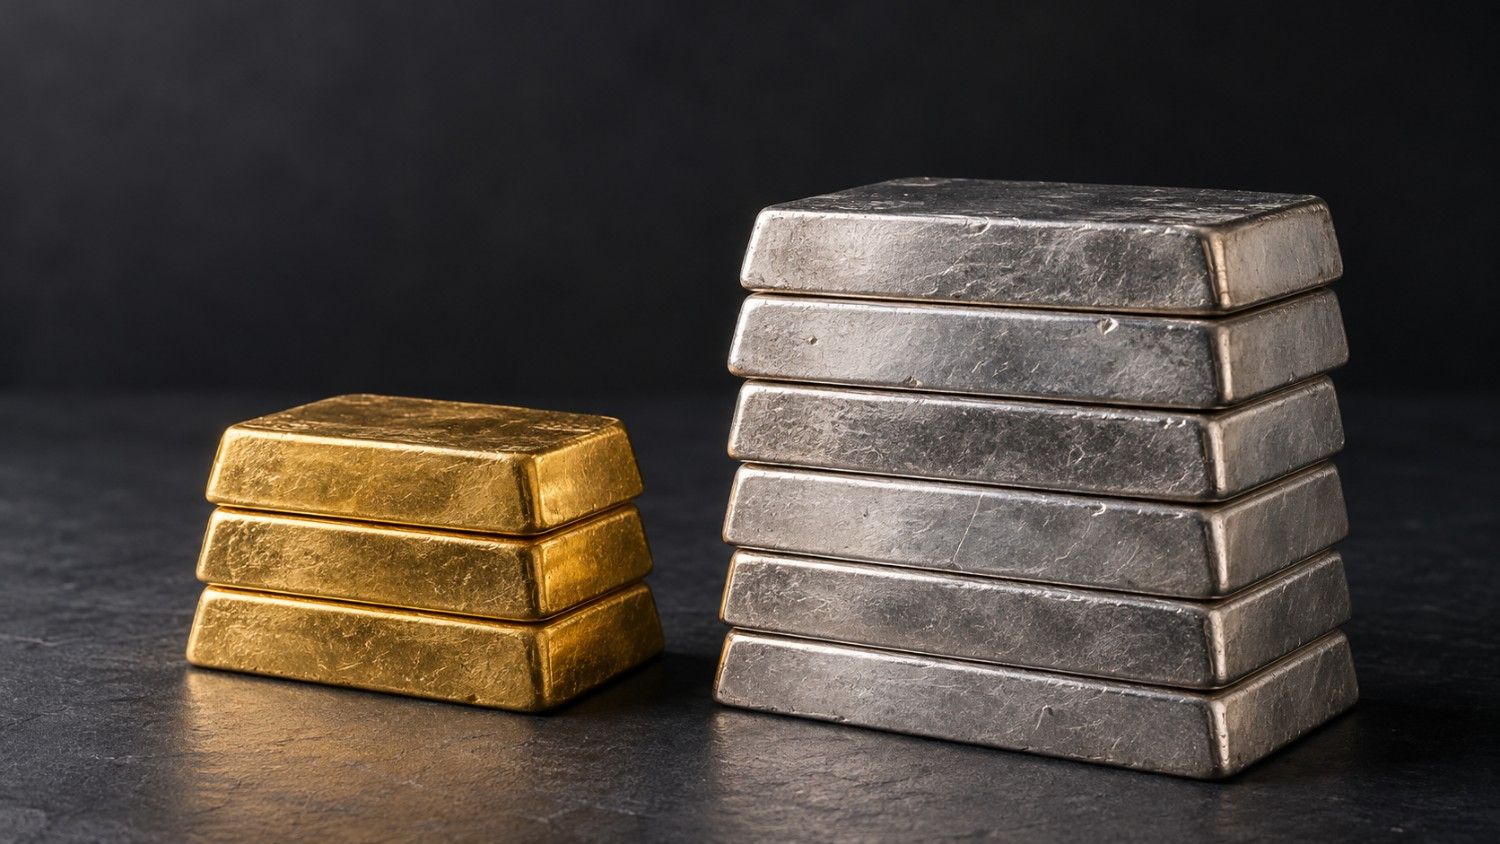
Silver prices fell nearly three times faster than gold this month, pushing the gold-silver ratio to 73:1. Analysts described the Thursday selloff as "very bizarre," noting a lack of correlation with the US dollar index and bond yields. This divergence suggests the move may be driven by liquidations from the tech sector or potential yen intervention rather than fundamental metal weakness.
India sees massive domestic discount ahead of Diwali
Indian bullion markets experienced a sharp correction, with 24-carat gold falling ₹4,796 per 10 grams and silver dropping ₹16,503 per kilogram in a single week. The drop has revitalized retail demand in sarrafa (jeweler) markets, with traders reporting increased buying of silver idols and jewelry ahead of the festive season. The decline was exacerbated by high crude oil prices and the strength of the US dollar against the rupee.

Metals Focus maintains bullish long-term forecasts
Despite the current pullback, UK-based research firm Metals Focus maintains that the structural bull market is intact. They forecast an average gold price of $5,330 in 2027, with potential peaks reaching $6,000, and predict silver will return above $90. The firm argues that persistent geopolitical friction and central bank buying provide a solid floor for prices.
Local view
China: Chinese media highlighted that the People's Bank of China (PBOC) increased its gold reserves by 21 tonnes in September, the largest monthly gain in three years. This marks the 23rd consecutive month of accumulation, signaling a continued strategy of reserve diversification away from the dollar. Domestic Shanghai Gold Exchange (SGE) prices tracked the international drop, with London gold hovering between $4,000 and $4,200.
India: Local Hindi outlets reported that the price drop has created a "good opportunity" for retail investors and families planning for the upcoming wedding and festival season. Dealers in Indore and Delhi noted a surge in physical silver demand, particularly for religious items, as prices fell below ₹200,000 per kilogram.
Context & numbers
- Spot Gold: Closed the week near $4,012-$4,030, with an intraday low of $3,986.50 on Oct 23.
- Gold-Silver Ratio: Widened to 73:1, indicating relative weakness in silver.
- ETF Holdings: Global physically backed gold ETF holdings remain above 4,000 tonnes, with June outflows offset by strong inflows in H1 2026.
- Central Bank Buying: The PBOC added 21 tonnes in Sept 2026; global central banks purchased ~863 tonnes in 2025.
On the radar
- Fed Decision: Markets are pricing in a hawkish stance at the upcoming Federal Reserve meeting, with oil-driven inflation remaining the primary headwind for bullion.
- Yen Intervention: Analysts are watching for signs of Japanese yen intervention, which could explain the "bizarre" decoupling of gold prices from US yields.
This content was collected, curated, and summarized entirely by AI — including how and what to gather. It may contain inaccuracies. Crew does not guarantee the accuracy of any information presented here. Always verify facts on your own before acting on them. Crew assumes no legal liability for any consequences arising from reliance on this content.
Powered by
