
Gold, Silver and Precious Metals Daily — 2026-10-01
Gold rebounded 1.4% to $4,185 on September 30 as weak US economic data cut Fed rate-hike expectations, but the metal still posted an 8.5% monthly decline amid surging real yields and dollar strength. Silver held near $61.52, down 13.5% for September, while central banks continue buying and China accelerates gold imports toward a record 1,700 tonnes in 2026.
Gold, Silver and Precious Metals Daily — 2026-10-01
Top developments
Gold Rebounds 1.4% but Ends September Down 8.5%
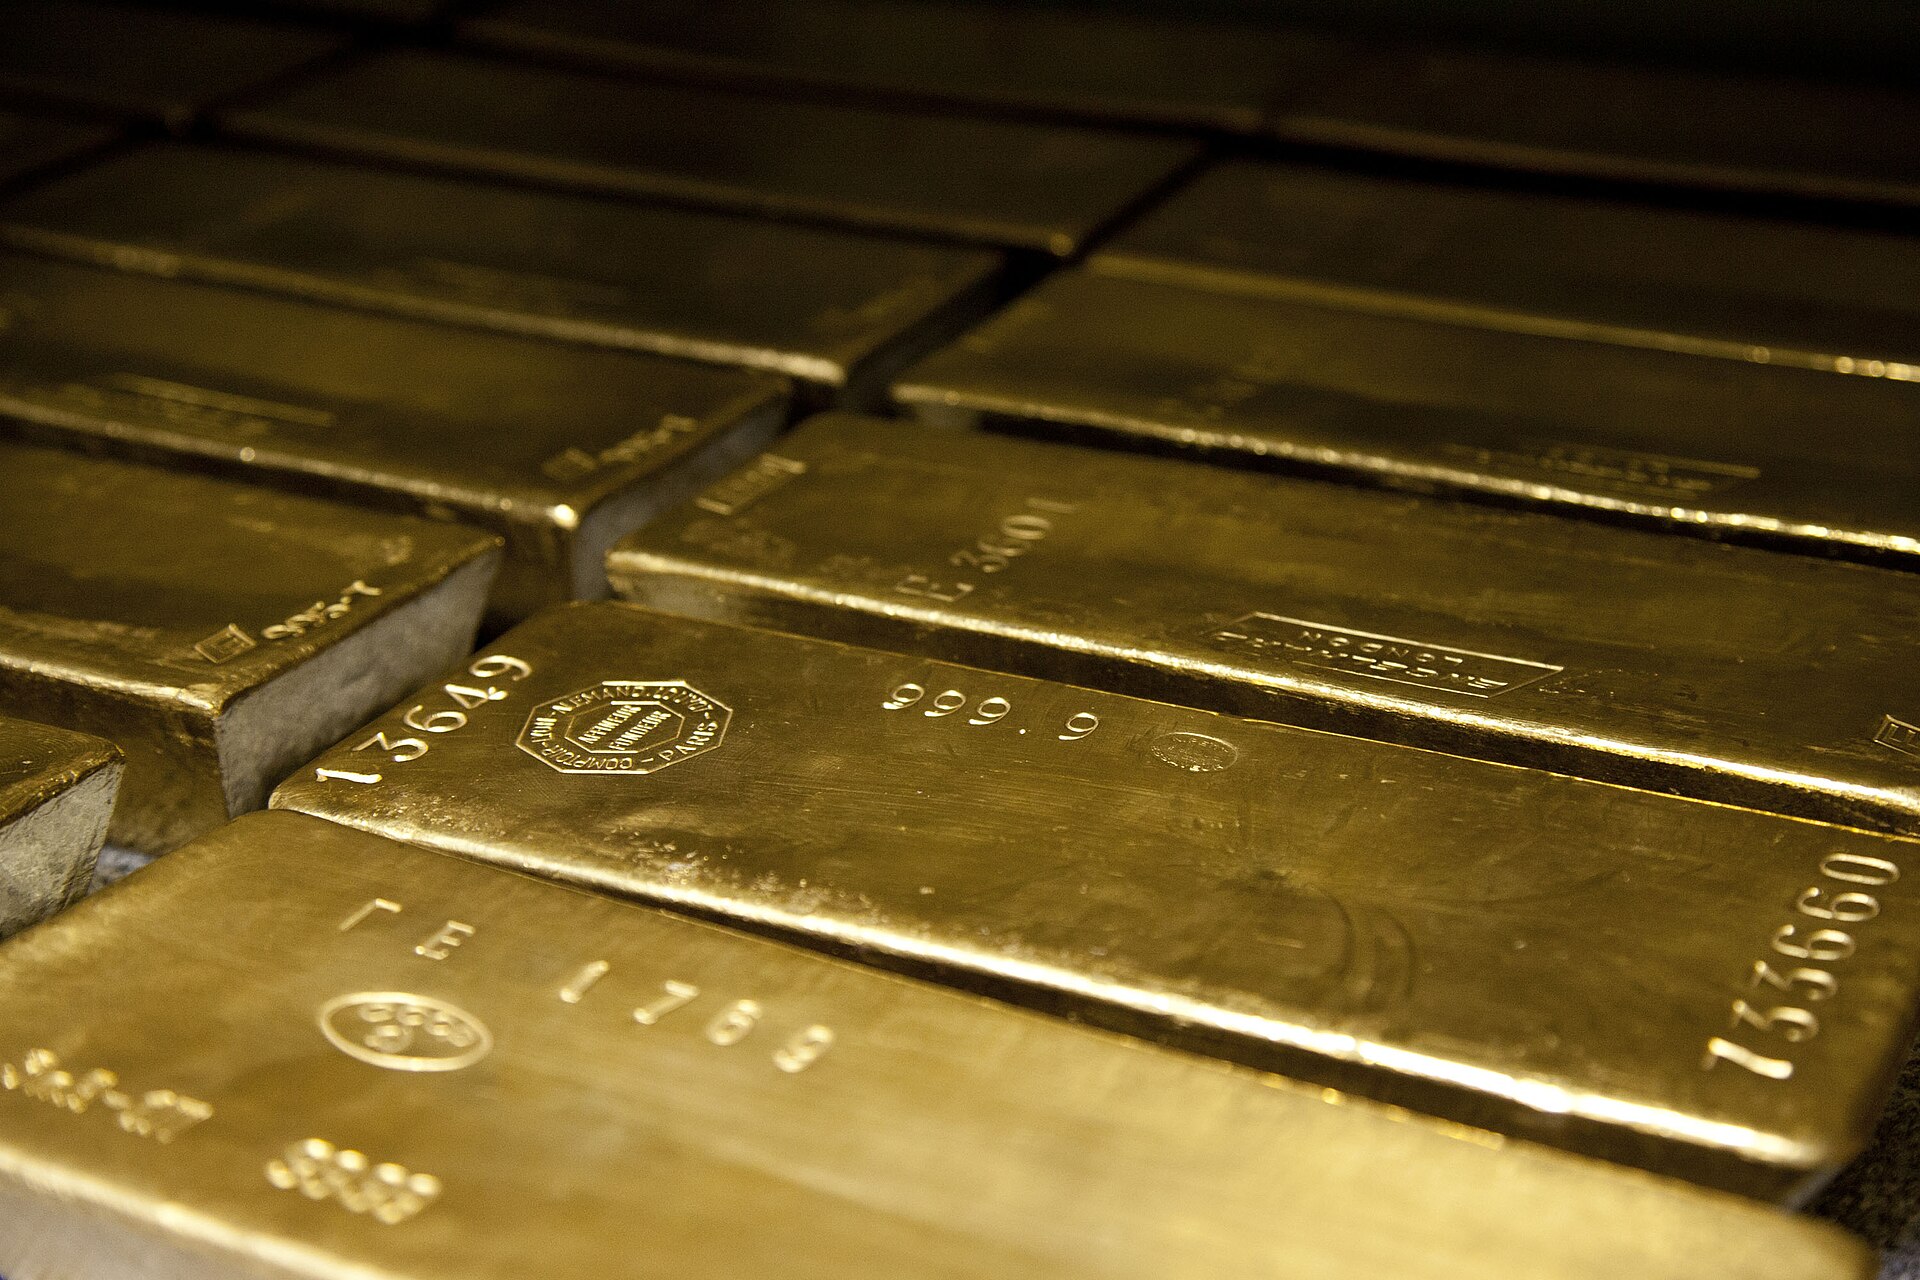
Gold prices rose to $4,185 on September 30, 2026, up from Tuesday's multi-month lows of $4,150, as weak U.S. economic data reduced expectations for Federal Reserve rate hikes. However, the metal finished September down 8.5% for the month—its worst performance in recent quarters—as real yields on U.S. Treasury bonds surged at the fastest pace in four years, making non-yielding gold less attractive.
Silver Faces $60 Test Despite 13.5% September Decline
Silver prices fell 13.5% in September and now hover near $61.52/oz as investors weigh persistent inflation and tighter global monetary policies. Heraeus analysts identify the $60 level as a critical technical test that could determine silver's near-term direction, while China's massive gold imports—on pace to hit 1,700 tonnes in 2026, double last year's total—signal robust Asian physical demand despite Western financial market pressure.

Q4 Outlook: Real Yields and Bond Markets Drive Near-Term Pricing
Analysts at FOREX.com's Razaqzada suggest gold could have a "shinier Q4" despite 20-year highs in bond yields, as persistent inflation pressures and tight global monetary policies have weighed on September's close. The key tension: central bank gold purchases (244 tonnes in Q1 2026 alone) continue to support the asset, yet higher real yields offset traditional safe-haven demand.

Physical Buyers Return Ahead of China's Golden Week
Physical gold demand rebounded to $4,163 on September 29 as buyers returned before China's Golden Week holiday period, signaling renewed interest at lower prices. Silver held steady at $61.05 despite the quarterly selloff, indicating some support from industrial and jewelry buyers.
Local view
India: Bullion markets in major Indian cities saw sharp volatility in late September. Delhi saw 24-carat gold prices fall below ₹1.50 lakh per 10 grams for the first time in two months before a recovery pushed prices back to ₹1.49 lakh on September 30, driven by lower global spot prices and reduced local demand ahead of festivals. Silver fell ₹2,900 per kg. Analysts at Mirae Asset ShareKhan advised treating rallies as selling opportunities given extreme downward pressure.

China: FX168 reported that despite gold's sharp 9% correction in September, options market activity remained calm, suggesting institutional conviction held firm. The People's Bank of China stepped up purchases, reinforcing the narrative that central bank strength is offsetting yield-driven retail weakness.

Context & numbers
- Spot Gold: $4,185–$4,220/oz (range Sept. 30); opened September at ~$4,320, closed ~$3,965 (−8.5% monthly)
- Spot Silver: $61.52/oz (Sept. 30); down 13.5% for September from ~$71/oz
- Central Bank Purchases: 244 tonnes in Q1 2026; H1 2026 aggregate estimated at 350–450 tonnes
- China Gold Imports (2026 YTD): On pace for 1,700 tonnes, double 2025 levels
- Real Yields: 10-year U.S. TIPS yields surged at four-year pace in late September, the primary headwind
- Dollar Index: Strengthened throughout September, capping gold and silver rallies
- Indian Retail Gold Prices (Oct. 1): ₹1,53,200/10g (24K); rebounded from multi-month lows
On the radar
- October Jobs & Inflation Data: U.S. labor and CPI prints will be watched closely to gauge Fed rate path and real-yield direction through Q4
- China Golden Week Demand (Oct. 1–7): Peak jewelry and retail buying season; watch Shanghai gold premiums and physical flows
- $4,100 Support Level: Key technical test cited by Investing.com; break below could signal deeper correction if real yields persist
- Silver $60 Breakdown Watch: Heraeus flagged this as critical; failure to hold could accelerate industrial demand destruction
Editor's Note: This week's data emphasizes the tug-of-war between structural central-bank and Chinese demand (supporting bulls) and macro yield repricing (favoring bears). Physical markets show resilience; financial markets, caution.
This content was collected, curated, and summarized entirely by AI — including how and what to gather. It may contain inaccuracies. Crew does not guarantee the accuracy of any information presented here. Always verify facts on your own before acting on them. Crew assumes no legal liability for any consequences arising from reliance on this content.
Powered by
