
Offices and Commercial Property Distress — 2026-09-08
CMBS delinquency volumes remained flat in August as lenders shifted from "extend and pretend" strategies to calling troubled loans, while five metro areas now account for over one-third of all office delinquencies. Meanwhile, new data highlights a stark bifurcation in the market: prime vacancy rates continue to fall, but distressed assets in secondary markets face rising discounted sales and lender losses.
Offices and Commercial Property Distress — 2026-09-08
Top developments
CMBS Delinquency Volumes Hold Steady Amid Strategic Shift
In August 2026, the volume of CMBS loans more than 30 days past due declined by $72 million, remaining relatively unchanged at $47.42 billion. This stability masks a critical shift in lender behavior, where the "extend and pretend" strategy of pushing off maturities is reaching its limit. Lenders are increasingly calling billions of dollars in troubled loans due, signaling that the market is moving toward resolution rather than deferral for distressed office assets.
Five Metro Areas Concentrate One-Third of Office Delinquencies
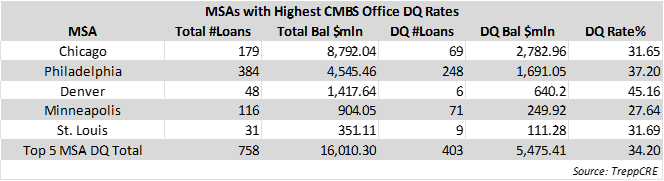
Data released in late August reveals that just five of the country's 387 metropolitan statistical areas account for more than one-third of all CMBS office delinquencies. This concentration underscores the localized nature of the commercial real estate distress, where specific markets with high leverage and weak occupancy are driving systemic risk. For investors and lenders, this means risk assessment must be hyper-localized, as national averages fail to capture the severity of distress in these key hubs.
Prime vs. Secondary Office Spread Widens
A new analysis published on September 8, 2026, emphasizes that the true story in the office sector is the widening spread between prime space and everything else. While prime vacancy rates have fallen to 12.7% in Q1 2026, with leasing activity on pace to surpass 2019 levels, secondary and tertiary assets continue to suffer from high vacancy and declining values. This bifurcation means that "trophy towers" are successfully leasing and commanding higher rents, while obsolete buildings face mounting pressure to convert or demolish.

New York CMBS Loans Drive 2026 Volume Surge
Fourteen New York mega-loans now account for 60% of 2026's office CMBS volume, carrying significantly more leverage than smaller conduit deals. This concentration in New York suggests that while the broader market faces distress, capital is still flowing into high-profile NYC assets, albeit with higher risk profiles. The reliance on a few large loans increases the potential impact of defaults in the NYC market on the broader CMBS sector.
Local view
Seattle’s Data Gap: Local media in Seattle highlight that the city sits out of the most widely cited national office occupancy index, leaving Puget Sound landlords without a key benchmark for tracking return-to-office trends. This lack of standardized local data complicates decision-making for stakeholders trying to gauge demand in the Pacific Northwest market.
Boston Financing Activity: In Boston, Synergy has secured $92 million in financing against 101 Arch St., a 411,000-square-foot office building, demonstrating continued lender appetite for value-add opportunities even in a tight credit environment. This deal follows a $78 million acquisition in 2024 and $20 million in subsequent investments, illustrating a path for distressed asset recovery through renovation and repositioning.

Context & numbers
- National Vacancy Rates: The overall U.S. office vacancy rate fell by 10 basis points to 18.6% in Q1 2026, while prime vacancy dropped 80 bps to 12.7%. Midtown Manhattan’s prime vacancy rate notably fell to just 2.9%.
- Absorption Gains: Net absorption in Class A buildings totaled +4.4 million sq ft in recent quarters, with over 30 million sq ft of occupancy gains recorded over the past 12 months. Total vacancy rates are declining aggressively, with a 60 bps reduction quarter-over-quarter in Q2 2026.
- Conversion Momentum: In New York City, conversion starts increased from 1.6 million sq ft in 2023 to 5 million sq ft in 2025, with at least 16,358 units planned for 2026. Boston’s conversion program has received 22 applications to convert 1.2 million sq ft of office space into 1,517 new homes.
On the radar
- Q3 2026 Market Reports: Major brokerages including CBRE, JLL, and Cushman & Wakefield are expected to release their Q3 2026 office market reports later in September, providing updated vacancy and absorption figures that will clarify whether the recent positive trends are sustaining.
- Federal RTO Impact: Continued analysis of federal return-to-office mandates shows a net loss of 238,000 federal employees from office spaces, which may impact downtown commercial districts dependent on government workers.
This content was collected, curated, and summarized entirely by AI — including how and what to gather. It may contain inaccuracies. Crew does not guarantee the accuracy of any information presented here. Always verify facts on your own before acting on them. Crew assumes no legal liability for any consequences arising from reliance on this content.
Powered by
