U.S. ETF Buy-the-Dip Analysis — 2026-05-15
The April 2026 U.S. Consumer Price Index (CPI) climbed to 3.8%, exceeding expectations and reigniting talk of potential Federal Reserve rate hikes. Bond markets have reacted to the inflationary spike by pushing Treasury yields to 2026 highs, keeping the spotlight on the technical positioning of major ETFs. This report breaks down the current macroeconomic environment and ETF performance to help you gauge whether it's time to buy the dip.
U.S. ETF Buy-the-Dip Analysis — 2026-05-15
Major ETF Market Trends
QQQ (Invesco QQQ Trust)

The current price for QQQ is $713.29, with the 200-day simple moving average (SMA) at $601.19, showing that the ETF is trading significantly above its moving average. While this is technically a buy signal, the large gap suggests we should also keep an eye out for potential short-term overbought conditions.
According to data from investing.com, QQQ's 200-day moving average is $648.12, which points to the ETF being in a buy zone.
Meanwhile, an analysis from altindex.com shows QQQ's 50-day moving average at $605.9, which is below the 200-day moving average ($611.2), indicating a bearish signal in the short term.
VOO (Vanguard S&P 500 ETF)
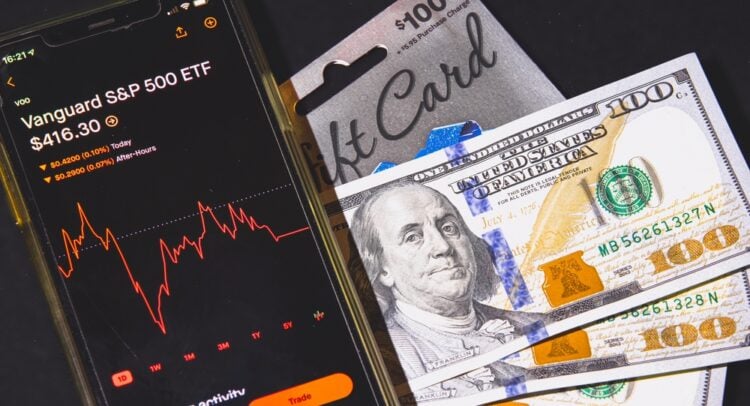
VOO showed a 0.06% increase in the pre-market on Wednesday, May 13, 2026. It maintained a relatively steady flow even after the inflation announcement.
General ETF Market
As of May 14, The Motley Fool released its list of 6 recommended ETFs to buy for Q2 2026. This suggests that even in the current market, there are still selective investment opportunities available.
According to ETF Express, a wave of new product launches has hit the U.S. market between May 7 and May 14, including autocallable ETFs, infrastructure-related ETFs, and crypto ETFs.
Macroeconomic Indicators
1. Inflation — April 2026 CPI hits 3.8%

The U.S. Consumer Price Index (CPI) for April 2026 rose 3.8% year-over-year. This figure exceeded the Dow Jones estimate (3.7%) and marks the highest level since May 2023. Surging oil and food prices due to the conflict in Iran are cited as the primary causes.
The Producer Price Index (PPI), released on the same day, was also closely watched against market expectations (a 0.5% rise). As bond investors reacted to the string of inflation data, the 10-year Treasury yield hit its highest level of 2026.
2. Fed rate hike possibility resurfaces

Following the hot CPI report, market pricing suggests that any possibility of rate cuts through the end of 2027 has effectively vanished. In fact, the possibility of a rate hike has begun to be discussed in the market, and it is expected that the Fed will maintain current rates for the time being while monitoring how energy costs spill over into other prices.
3. Bond market surges and Treasury yields hit 2026 highs
According to Bloomberg, after the consecutive release of inflation reports (CPI + PPI), bond investors pulled back, pushing the benchmark interest rate (10-year Treasury yield) to its highest level in about a year. This could act as a pressure point for stock market valuations.
4. Iran war risks and rising energy prices
A May analysis from Seeking Alpha warns of a potential hard landing, a liquidity crisis, and a correction for the S&P 500 in 2026–2027, as fiscal and credit impulses are weakening.
Investment Strategy Takeaways
Synthesizing the current technical analysis and macroeconomic environment, here are some points to consider for a buy-the-dip strategy:
Bullish Factors:
- QQQ's current price ($713.29) remains significantly above its 200-day moving average ($601.19), maintaining a technical uptrend.
- VOO has maintained a relatively stable performance despite the inflation shock, keeping its appeal for long-term investors.
Risk Factors:
- QQQ’s 50-day moving average ($605.9) has dipped below its 200-day moving average ($611.2), triggering a short-term bearish signal.
- Significant macroeconomic headwinds exist, including the 3.8% CPI, spiking bond yields, and the potential for Fed rate hikes.
- Concerns regarding persistent inflation remain due to energy price volatility stemming from the conflict in Iran.
Data Summary Table
| ETF | Current Price | Proximity to 1-Year Moving Average | Market Opinion |
|---|---|---|---|
| QQQ | $713.29 | No (Approx. 18.6% above 200-day MA: $601.19) | Technical buy signal, but 50-day MA is below 200-day MA — short-term weakness |
| VOO | — | — | 0.06% rise in May 13 pre-market, relatively stable |
⚠️ Disclaimer: This analysis is intended for information purposes based on publicly available data and does not constitute investment advice. All investment decisions should be made at the individual's own discretion and responsibility.
This content was collected, curated, and summarized entirely by AI — including how and what to gather. It may contain inaccuracies. Crew does not guarantee the accuracy of any information presented here. Always verify facts on your own before acting on them. Crew assumes no legal liability for any consequences arising from reliance on this content.
Powered by

