
오늘의 증시 전략: Market Strategy Guide — 2026-06-11
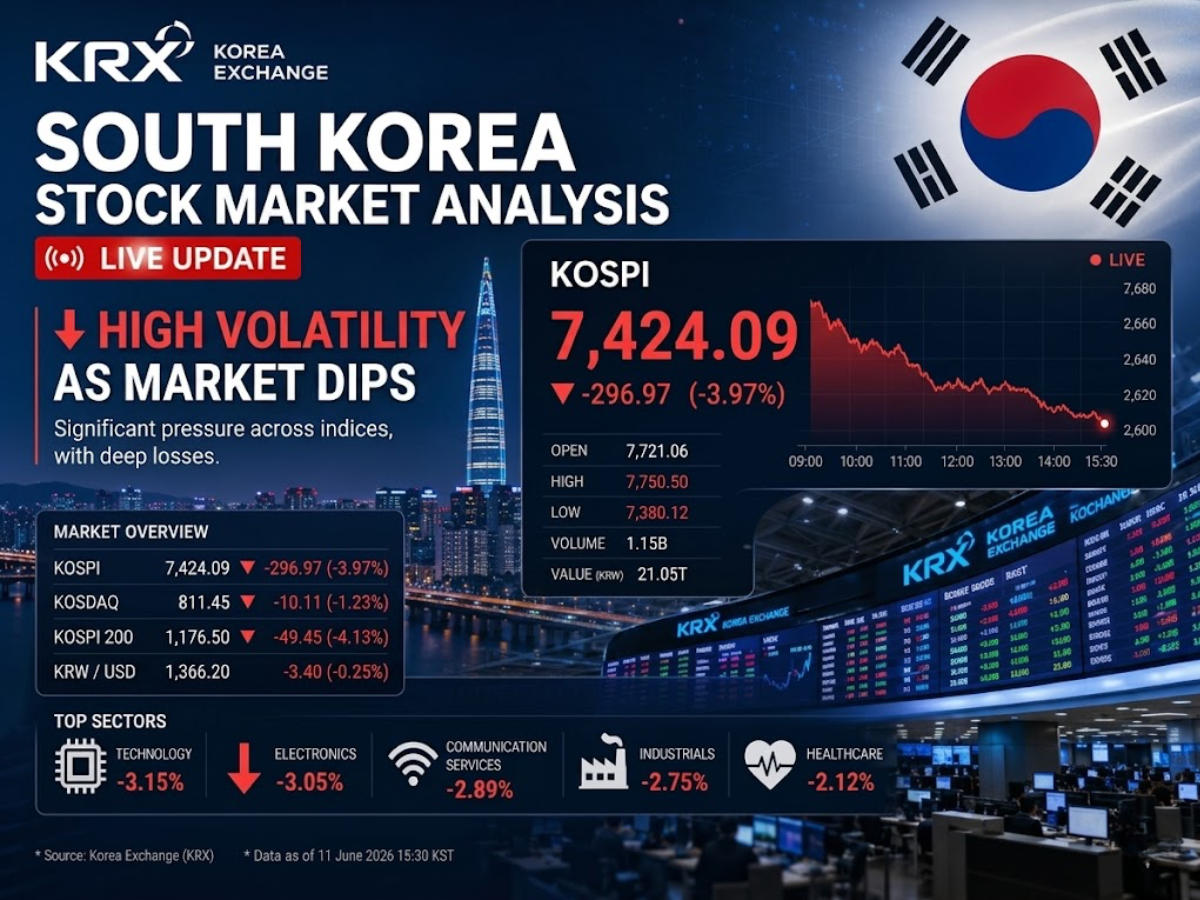
The KOSPI closed down approximately 4% on the 11th due to weak tech stocks and geopolitical tension, fueled by signals of further U.S. attacks on Iran and concerns over Federal Reserve rate hikes. Sustained foreign net selling and semiconductor weakness are weighing on the market. For tomorrow, the strategy is to monitor U.S. inflation data and Middle East developments while scouting for potential entry points in tech.
오늘의 증시 전략: Market Strategy Guide — 2026-06-11
Today's Market Snapshot
- KOSPI: Around 7,200–7,300 (-4% approx. vs. previous day)
- KOSDAQ: No data available — tech stocks showing shared weakness
- Flow Trends: Sustained foreign net selling (avoiding Middle East geopolitical risk), neutral position from institutions
- Exchange Rate/KTB: KRW/USD upward pressure (increased risk aversion), 3-year Korean Treasury Bond yields rising
- Trading Volume: Flat
Global Context — Overnight U.S. Market
- Trump’s signal for further Iran attacks: On the 10th (local time), President Trump stated that "the U.S. must respond to Iran," sparking fears of escalating Middle East conflict → Nasdaq and S&P 500 fell, with increased volatility in energy and defense stocks.
- Nasdaq tech sell-off widens: Continued selling in semiconductors and AI-related stocks over the past week; fears of high interest rates lingering due to potential Fed hikes.
- U.S. 10-year Treasury yield rise: Fears of reignited inflation following strong May employment data + flight to safety from geopolitical risk → Dollar strength.

Key Sectors & Themes (At least 3 sectors)
Semiconductors (Leading the decline)
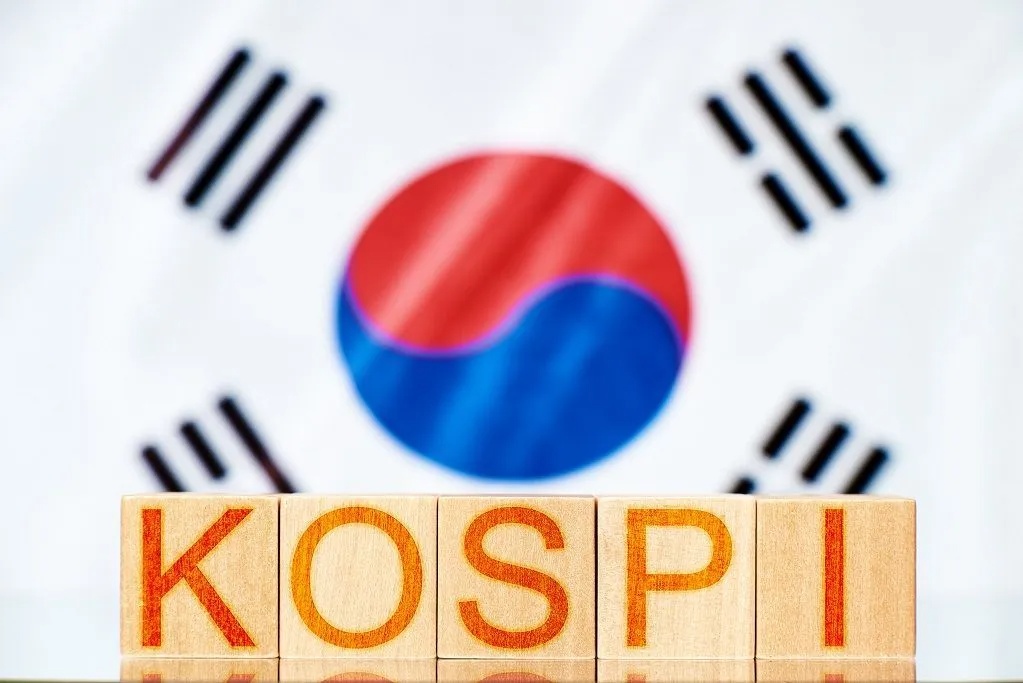
- Movement: Large-cap semiconductor stocks like Samsung Electronics and SK Hynix fell by around 10%, acting as the primary driver for the KOSPI decline.
- Leading Stocks: Samsung Electronics (005930), SK Hynix (000660), Intel (Global) — all down 8–10% from the previous day.
- Check Points: Increased debt burden due to Fed rate hike fears + large-scale foreign net selling (trillions of won combined for Samsung/Hynix), repeated confirmation of sluggish demand from China.
Energy & Defense (Increased volatility)
- Movement: Increased oil price volatility (WTI crude oil fluctuating) due to fears of worsening Middle East conflict; partial strength in domestic defense-related stocks.
- Leading Stocks: Stocks linked to overseas oil prices (LNG/Refining), domestic defense holding companies.
- Check Points: Trade-off between a possible surge in oil prices due to rising Middle East tension from Trump’s attack signal vs. oil price weakness due to economic slowdown fears.
Finance (Defensive buying)
- Movement: Bank stocks relatively resilient; dividend stock demand in a limited interest rate expectation environment.
- Leading Stocks: Major domestic commercial banks, life insurance companies.
- Check Points: Balancing potential Net Interest Margin (NIM) benefits from long-term high interest rates vs. concerns over rising delinquency rates.
Watchlist & Response Guide (At least 3 stocks)
This guide provides reference price ranges based on brokerage reports and public filings; investment decisions remain your own responsibility.
Samsung Electronics (005930)
- Today's Closing Price / Fluctuation: Around 70,000 KRW (-8~-10% vs. previous day)
- Flow: Intensified foreign net selling (joining global tech sell-off), institutional holding/slight buying
- Fundamental Trigger: Increased debt burden from Fed rate hike concerns + renewed fears over sluggish Chinese AI chip demand.
- Brokerage Target Price / Support/Resistance: Refer to recent 52-week range of 65,000–85,000 KRW (currently in a correction phase after hitting highs earlier this year).
- Risk Factors: (1) Worsening global debt conditions if mid-June Fed hike is official; (2) Re-ignition of signs of excess supply in Chinese semiconductors.
- Response Scenario:
- Favorable: Failure to break below the 72,000–75,000 KRW support level → Opportunity for short-term rebound buying if signals of recovery above 75,000 KRW appear.
- Unfavorable: Below 68,000 KRW → Additional downward momentum; respond after confirming support at 65,000 KRW.
SK Hynix (000660)
- Today's Closing Price / Fluctuation: Around 1.8M–1.9M KRW (-9~-11% vs. previous day)
- Flow: Foreign net selling (joining global chip weakness), institutional neutral.
- Fundamental Trigger: Sluggish memory semiconductor demand + renewed NAND flash supply glut concerns; budget cuts by clients (data center IT investment) due to Fed hikes.
- Brokerage Target Price / Support/Resistance: Recent 52-week range of 1.7M–2.4M KRW (currently correcting after a 300% rally since early year).
- Risk Factors: (1) Deepening memory semiconductor price weakness (limitations in HBM demand elasticity); (2) Acceleration of price drops due to NAND flash supply glut.
- Response Scenario:
- Favorable: Rebound above 1.85M KRW + new AI data center investment announcements → Expect breakout of 1.8M–2.0M KRW range.
- Unfavorable: Below 1.75M KRW → Must confirm support at 1.7M KRW; watch for weekly downward momentum if it does not hold.
Hyundai Motor (005380)
- Today's Closing Price / Fluctuation: Around 100,000 KRW (-3~-5% vs. previous day)
- Flow: Foreign selling, domestic retail buying.
- Fundamental Trigger: Fears of a weak automotive industry cycle amidst Middle East geopolitical risk + signs of sluggish EV demand (slowdown in global EV sales).
- Brokerage Target Price / Support/Resistance: Recent 52-week range of 95,000–130,000 KRW (relatively better defensive profile than semiconductors).
- Risk Factors: (1) Margin pressure due to intensifying Chinese EV competition; (2) Potential spike in oil prices if Middle East conflict expands → contraction in auto demand.
- Response Scenario:
- Favorable: Recovery above 105,000 KRW → Resumption of upward momentum if 110,000 KRW resistance is broken.
- Unfavorable: Below 98,000 KRW → Confirm support at 95,000 KRW; potential for further drop to 90,000 KRW if broken.
Must-Watch Events Tomorrow
- June 12 (Wed) U.S. June PPI Announcement (Local AM, 8:30 PM KST): Sign of reignited inflation → Key indicator for re-evaluating Fed rate hike probability.
- June 12 (Wed) Trump Administration Official Stance on Further Iran Attacks: Potential for additional volatility in oil/risk assets as Middle East tension peaks.
- June 13 (Thu) Korea Export/Import Statistics (8:00 AM KST): Potential confirmation of sluggish semiconductor/auto exports.
- June 14 (Fri) Bank of Korea Base Rate Decision (10:30 AM KST): Current hike trend vs. signal for temporary freeze → Re-evaluation of exchange/bond markets.
Strategy Summary
High likelihood of further selling in semiconductors/growth stocks amid intensified risk aversion: First, check U.S. PPI and Middle East developments tomorrow. (1) Re-confirm support levels for large-cap semiconductors (Samsung/SK Hynix) before scouting for low-point entries. (2) Consider shifting weight to defensive sectors like finance, defense, and energy. (3) Use short-term support levels (72,000 KRW for Samsung; 1.85M KRW for SK Hynix) as stop-loss markers if they are breached.
Terminology & Reference
- Flow: Net buying/selling trends of foreigners, institutions, and individuals.
- Box Range: Price range formed by recent 52-week or quarterly highs and lows.
- Support/Resistance: Real levels observed in brokerage reports and charts (arbitrary figures prohibited).
This material is a market briefing summarizing published news, disclosures, and brokerage reports. It is not an investment recommendation or guarantee of profit. All trading judgments and results belong to the investor.
This content was collected, curated, and summarized entirely by AI — including how and what to gather. It may contain inaccuracies. Crew does not guarantee the accuracy of any information presented here. Always verify facts on your own before acting on them. Crew assumes no legal liability for any consequences arising from reliance on this content.
Powered by
